Overview – ToolTips in StockChart
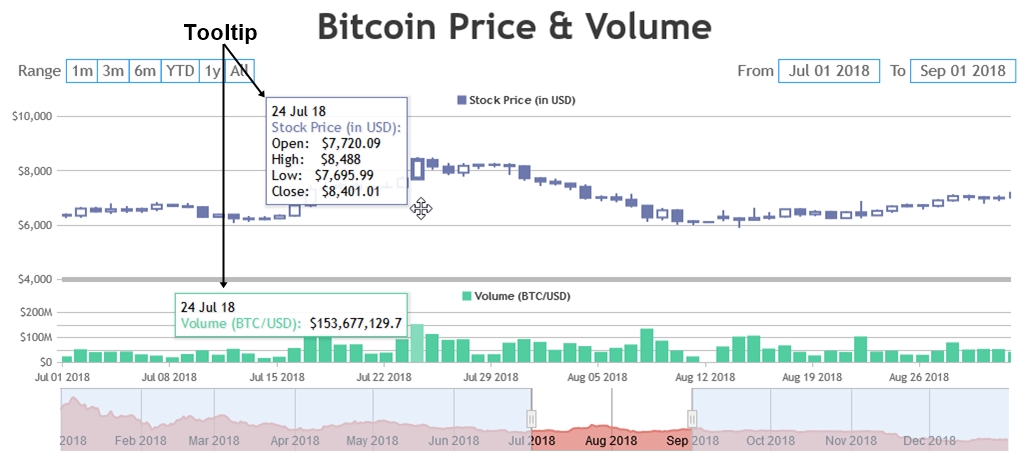
Tooltip appears whenever you move/hover mouse on any dataPoint in StockChart. It shows information about the dataPoint(s) depending on the current mouse position. In this tutorial you’ll learn about default behavior (like syncing) of ToolTip and how to customize the content, etc.

In this section you will learn about Tooltip and Syncing Tooltip across multiple charts in a StockChart.
Default ToolTip
By default, content of the tooltip is automatically chosen based on various factors like chart type, whether tooltip is shared or not, dataPoint x and y values, etc. In StockChart, tooltip of multiple charts are synchronized with each other – which means, if you move/hover mouse on a chart, ToolTip will be shown for all the charts at corresponding x value. Tooltip’s border color will be same as that of dataPoint or dataSeries (which can be customized if required).
In the example below, try different chart types to see default behaviour of tooltip.
Customizing ToolTip
You can easily customize toolTip as required using the API. For example content of the toolTip can be customized using toolTipContent and contentFormatter, text color using fontColor, etc. Please refer this link for more info on toolTip customization.
Synchronized Tooltip across Multiple Charts
In case of StockChart, tooltips across multiple charts are synchronized by default. Below is a demo of the same.
Also See: