Overview – Adding & Customizing Charts
StockCharts allow you to have one or more Charts rendering different types of data across the same range as shown below. Charts support all the features mentioned in Charts documentation except for two exceptions – Bar Charts & Charts without an axis like Pie, Funnel, etc are not allowed. Also, all charts sync their Axis Range, ToolTip & Crosshair whenever you interact with any one of the charts.
Notes- We highly recommend that you familiarize yourself with various elements inside a Chart and Chart Options.
- Height of individual charts can either be set in pixels (like 300, 500) or in percentage (like “50%”, “70%”).
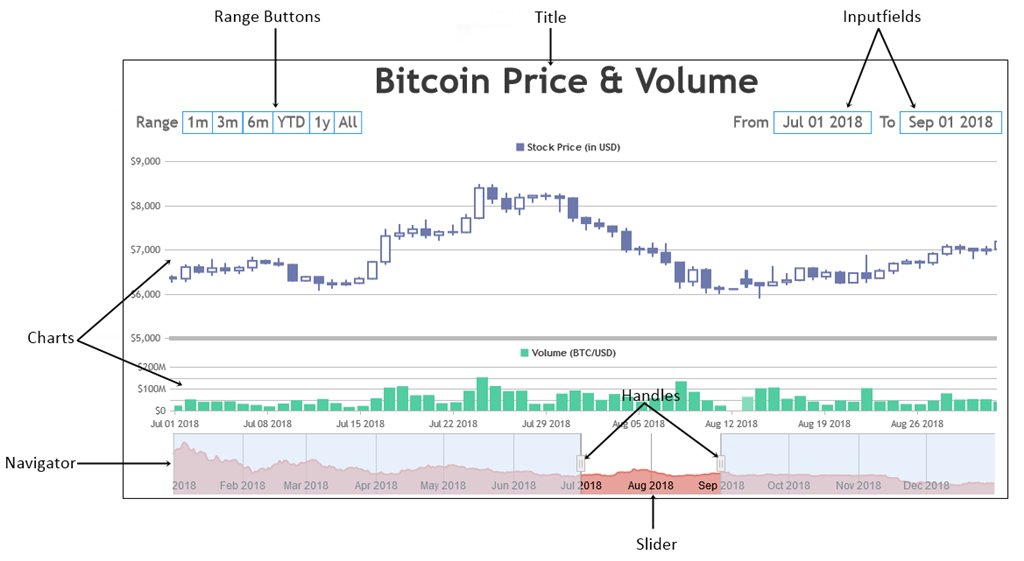
Below is a depiction of various StockChart elements.
Syntax
var  stockChart =  new  CanvasJS.StockChart("container",
{
 .
 .
 charts: [{
   .
   .
   }, {
   .
   .
 }],
 .
 .
});
stockChart.render();
Simple StockChart with just a single chart
Below is how you can create a simple StockChart with a single chart in it. In the next section we’ll show you how to add more of them.
Adding Multiple Charts
In order to show multiple charts in a StockChart you just need to add them to the charts array. In the following example we have two charts – one with stock price and another showing the volume.
Behavior of Zoom / Pan
There is one minor difference in behavior of zooming / panning of StockCharts compared to (regular) Charts. In StockChart, panning is enabled by default. But in case of regular charts, both panning and zooming are disabled by default.