Overview – Available Elements in CanvasJS StockCharts
The image below shows the basic elements of StockChart.
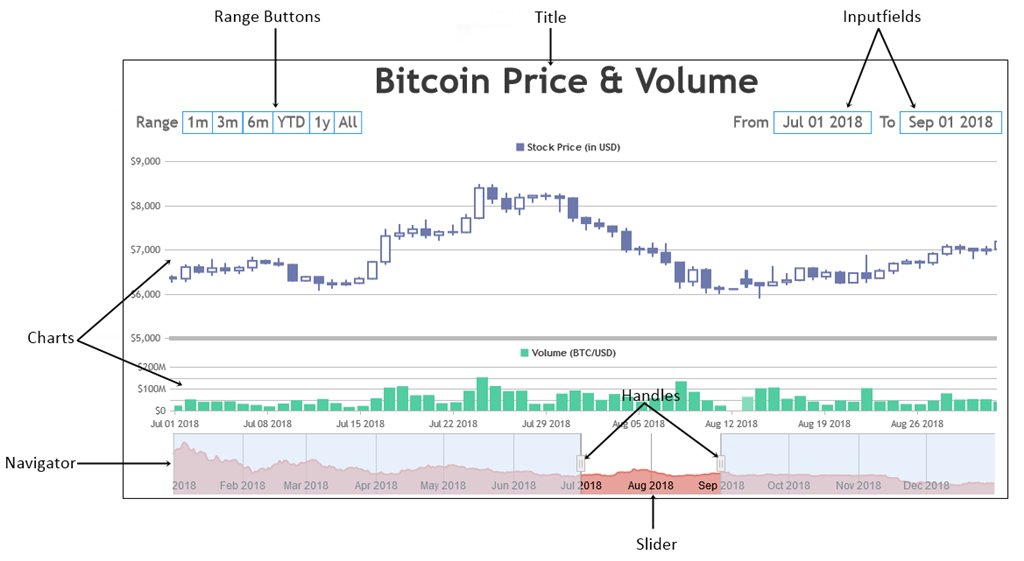
StockChart Title
StockChart title is used to describe the StockChart.
Charts
One or more Charts can be stacked vertically one below the other in StockChart.
Range Buttons
Range Buttons are used to control range of data to be shown in viewport of all charts.
Inputfields
Inputfields are used to control the range of data to be shown in viewport of all charts by entering the range manually. This gives more finer control over the range.
Navigator
Navigator is generally used to show a preview of the entire range of data being shown in charts. It also contains Slider which allow you to select the range of values to be shown in viewport of charts.
Slider
Slider is the element in Navigator which helps you to select the range.
Elements inside a Chart
We also recommend you to check and familiarize yourself with various elements inside a Chart.
In the next sections you will learn more about individual elements and options available in StockChart.