Overview – Enabling & Customizing Crosshair in StockChart
Crosshairs are interactive vertical or horizontal lines with a label to show the x/y axis value at the current mouse position. This is very useful whenever you want to see co-ordinates of any given point on the StockChart.
In this section you will learn about Crosshair and Syncing Crosshair across multiple charts in a StockChart.
Default Crosshair
By default, crosshairs are disabled. You can enable crosshair by setting enabled property of crosshair to true in the corresponding axis. Below is a demo of the same.
Customizing Crosshair
You can customize the look and feel of crosshair by changing thickness, lineDashType, labelFontColor, etc.
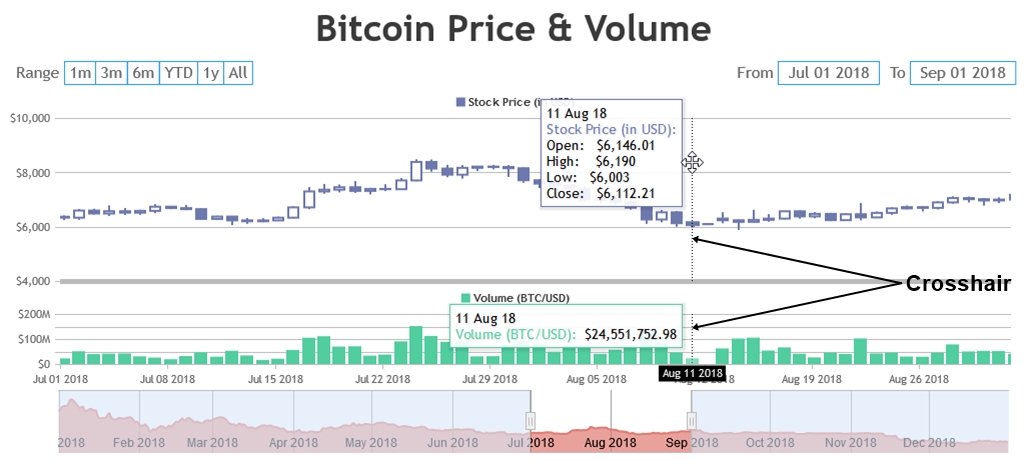
Synchronized Crosshair across Multiple Charts
In StockChart, crosshair of all the charts are synchronized – which means, if you hover/move mouse on a chart, crosshair will be shown for all the charts at the corresponding x value, when crosshair is enabled.