Angular Chart Component with 30+ Charts & Graphs
CanvasJS Angular Chart Component lets you visualize data using 30+ chart types like bar, line, area, pie, financial, etc. It has simple API to easily customize look & feel as per your application's theme. Angular Chart Library includes all the popular charts like line, column, area, bar, pie, etc. Below are some of the example on how to create charts & graphs in Angular. For step-by-step tutorial on integration, refer to our documentation on Angular Charts
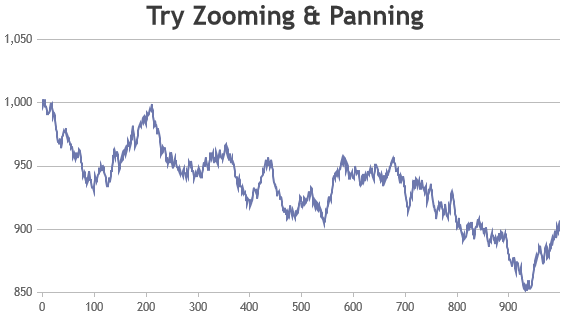
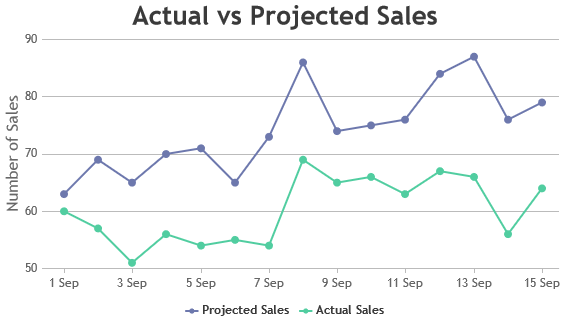

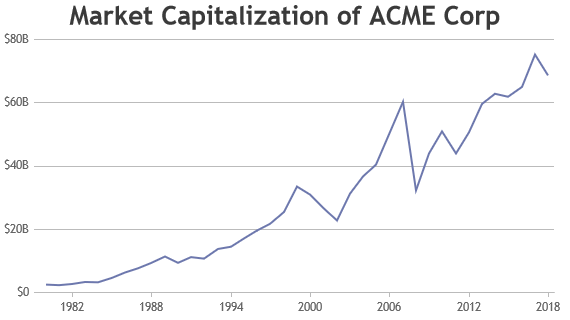
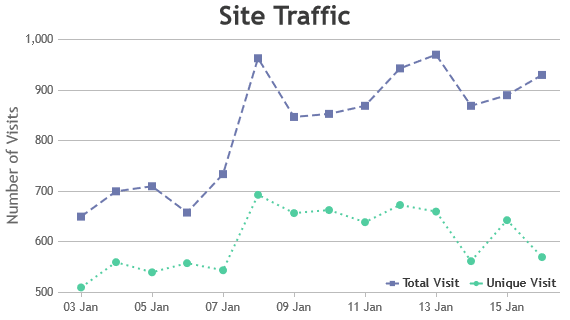
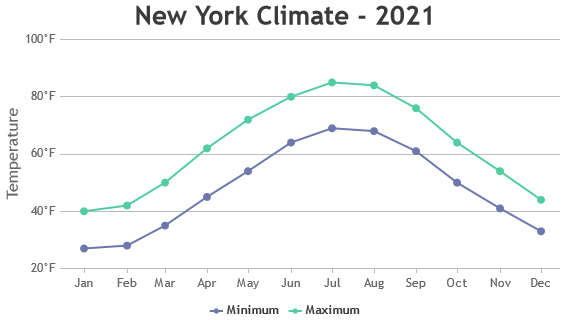
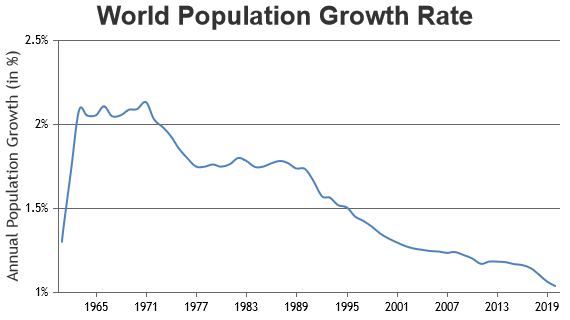
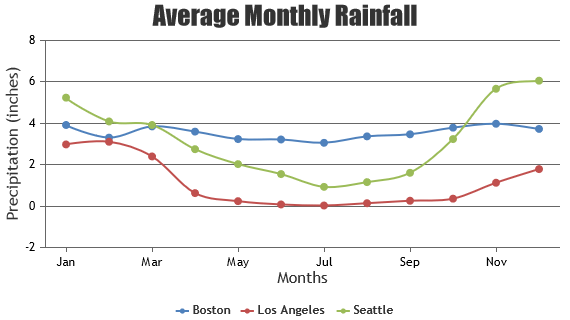
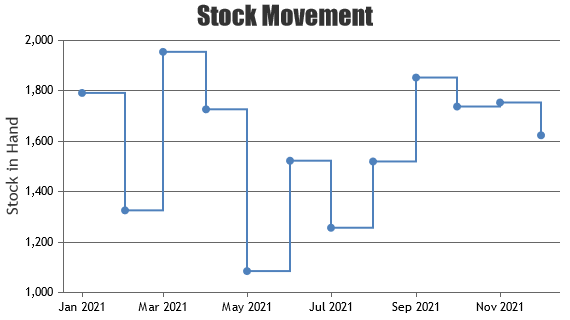
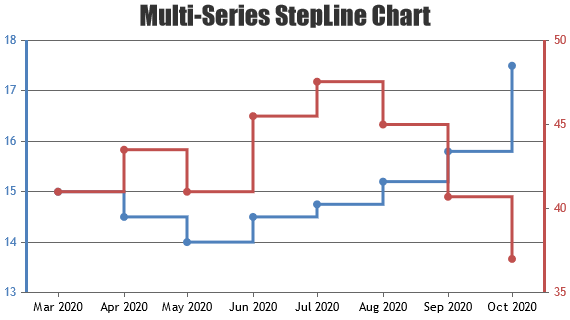
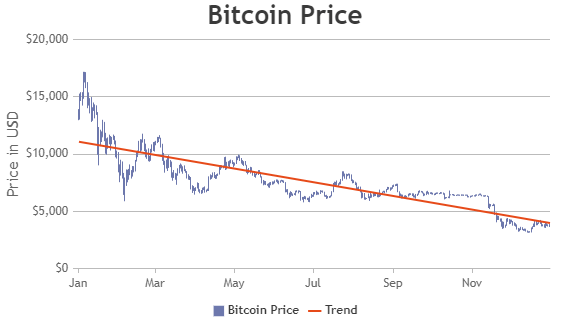
Line Charts in Angular
Angular Chart Component supports Line, Spline and Step Line Charts.
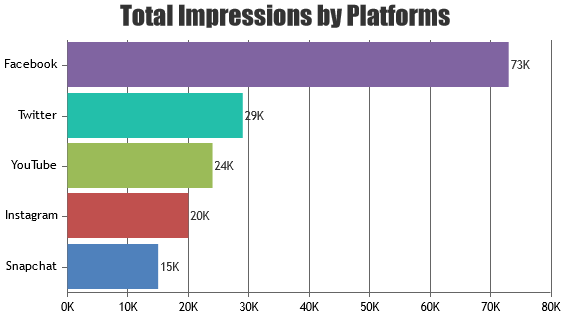
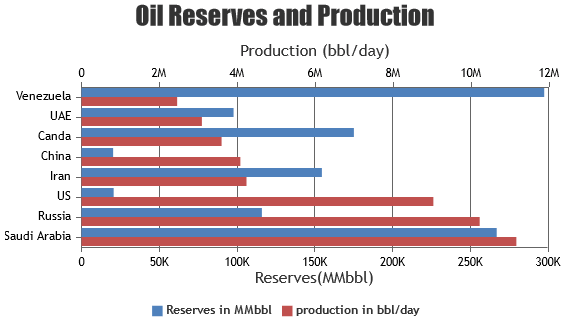
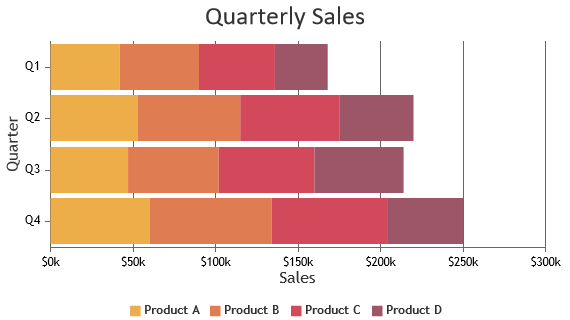
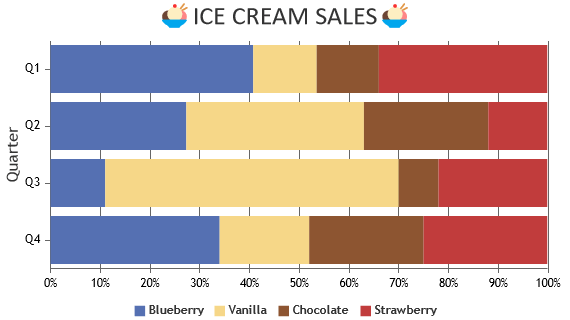
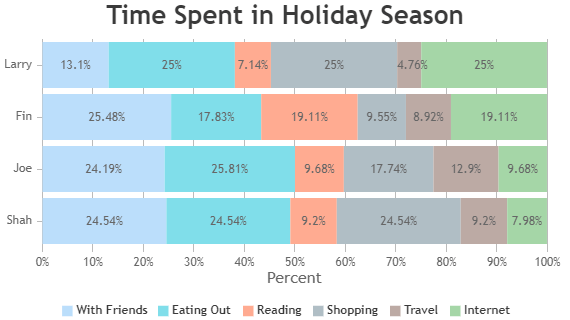
Bar Charts in Angular
Angular Chart Component supports Bar, Stacked Bar, Stacked Bar 100%, etc.
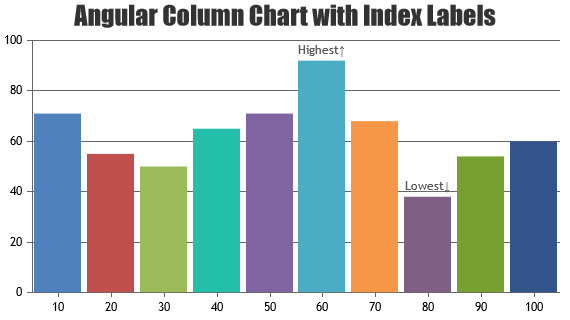
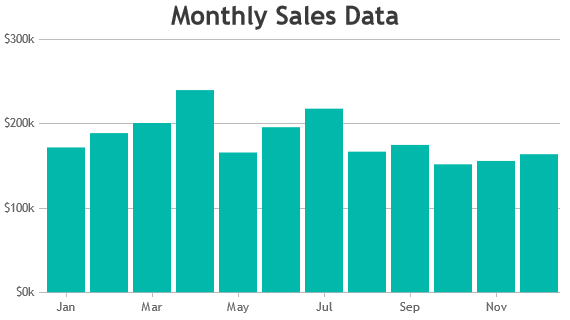
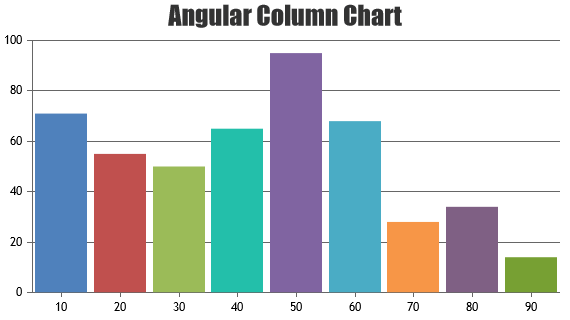
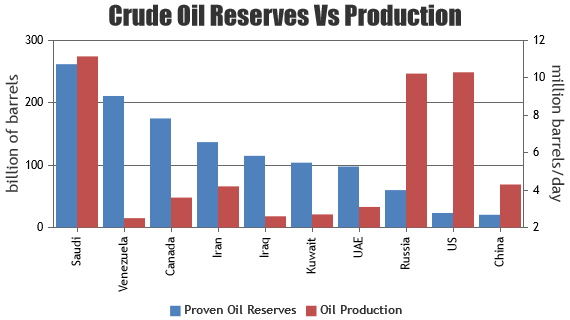
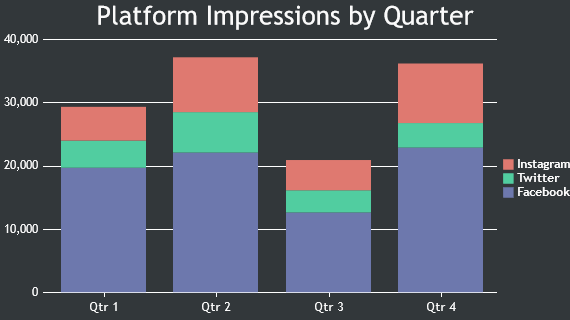
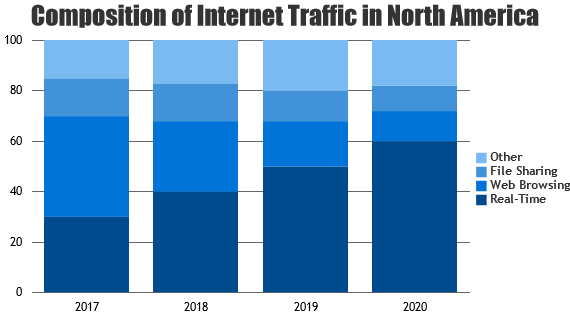
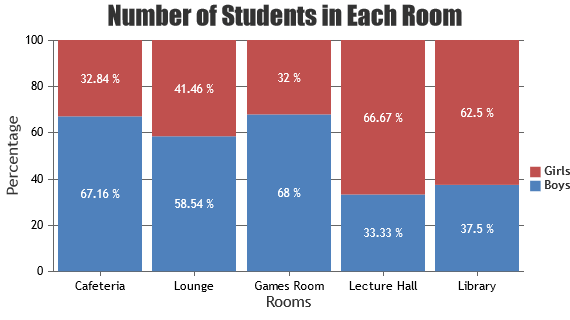
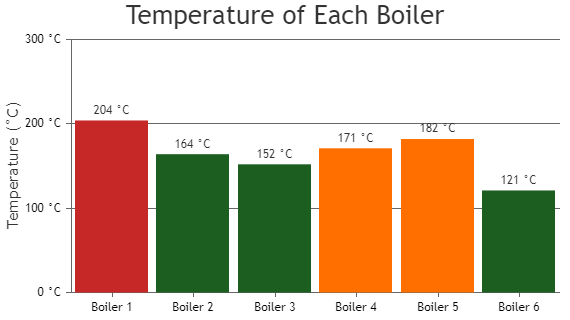
Column Charts in Angular
Angular Chart Component supports Column, Stacked Column, Stacked Column 100%, etc.
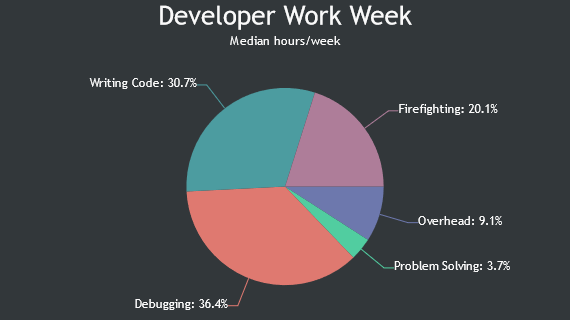
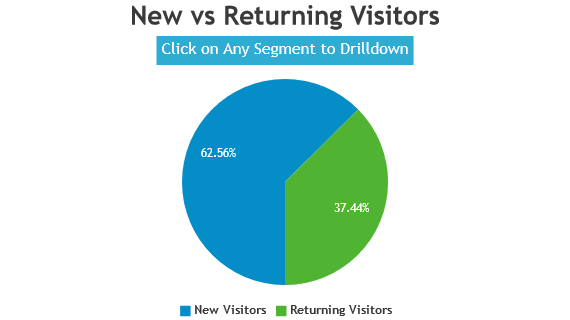
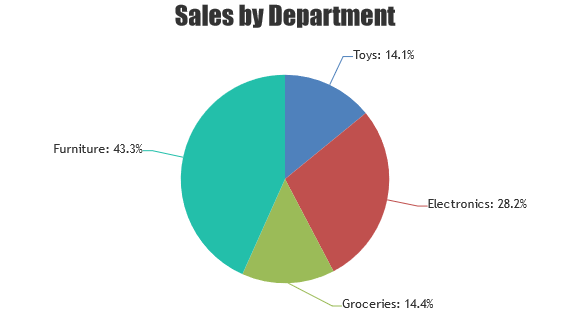
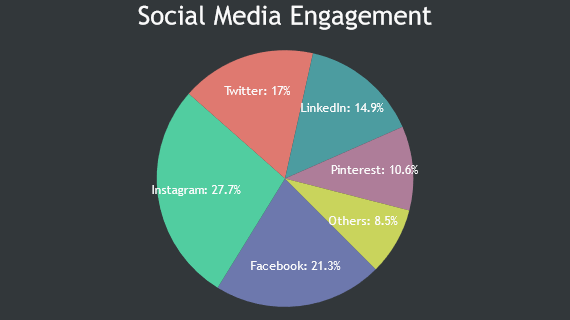
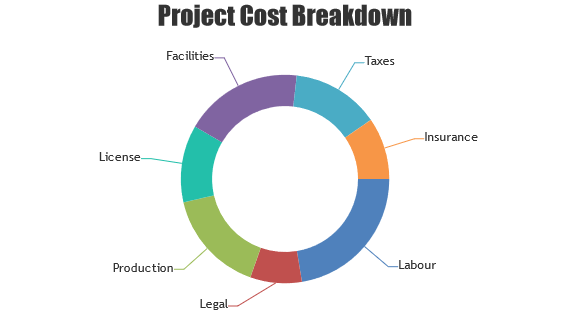
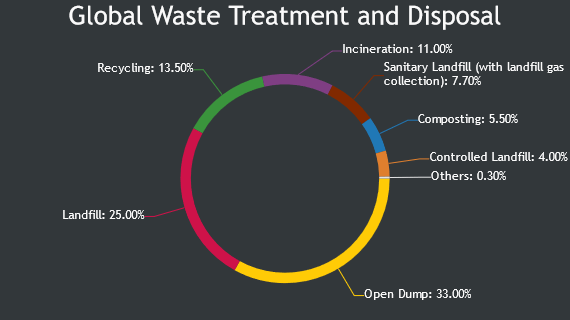
Pie and Doughnut Charts in Angular
Angular Chart Component supports Pie & Doughnut / Donut Charts.
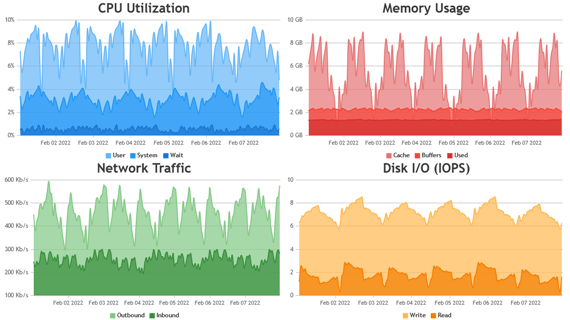
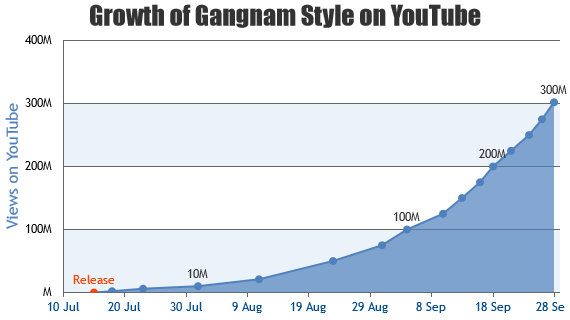
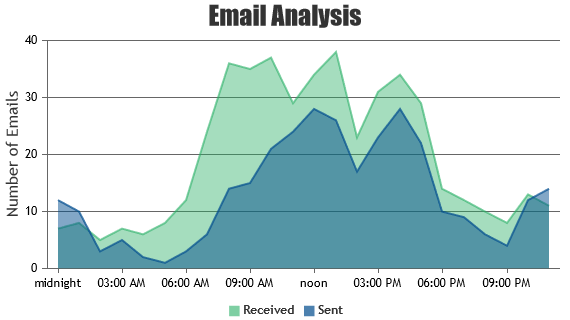
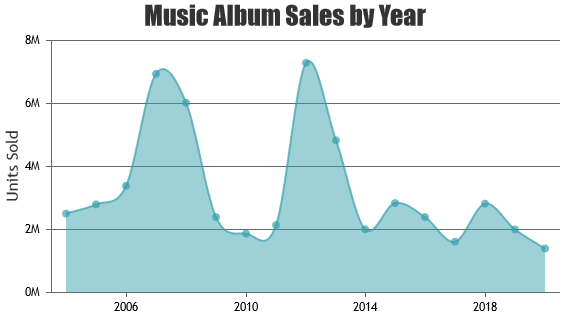
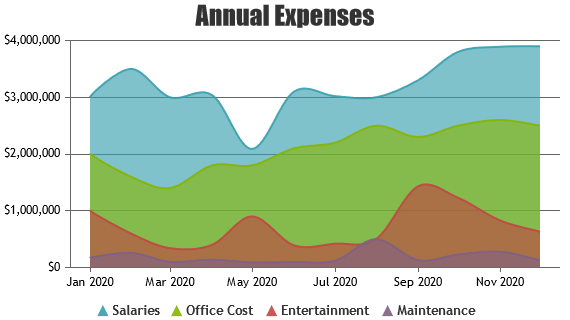
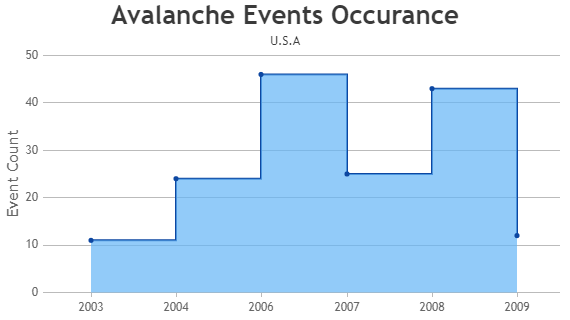
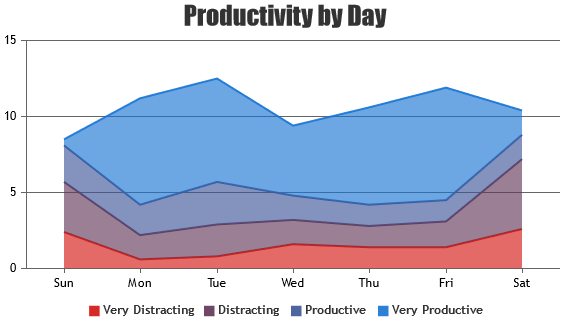
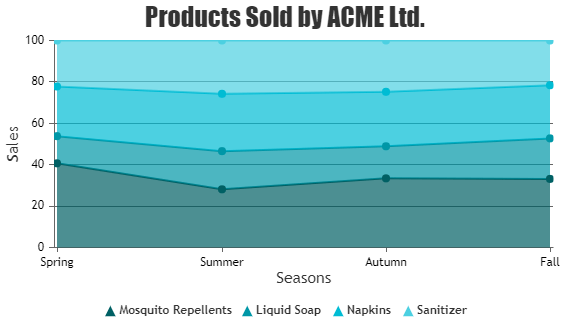
Area Charts in Angular
Angular Chart Component supports Area, Spline Area, Stacked Area, Stacked Area 100%, Stacked Spline Area 100%, etc.
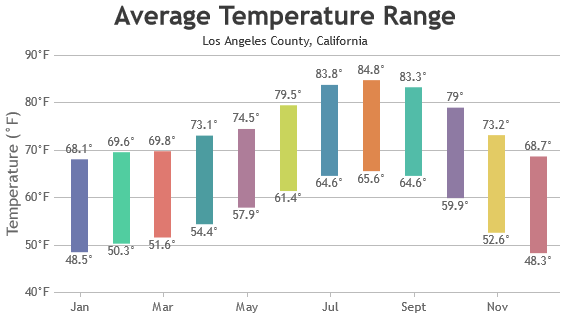
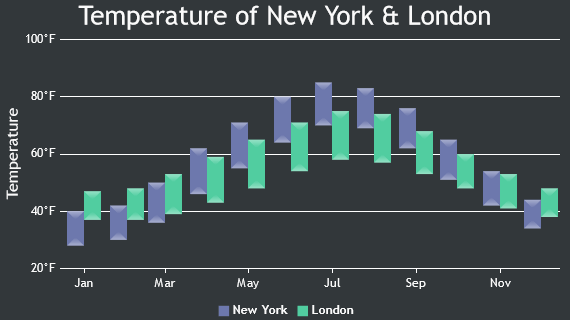
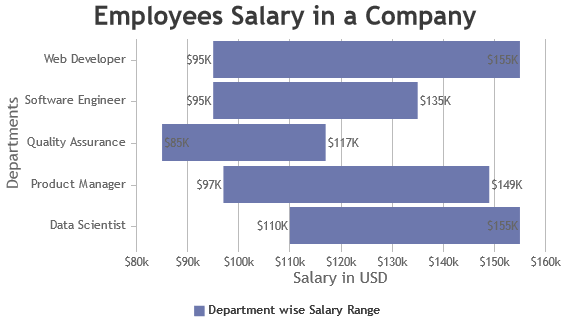
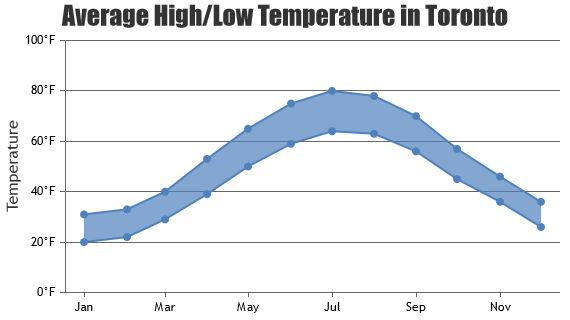
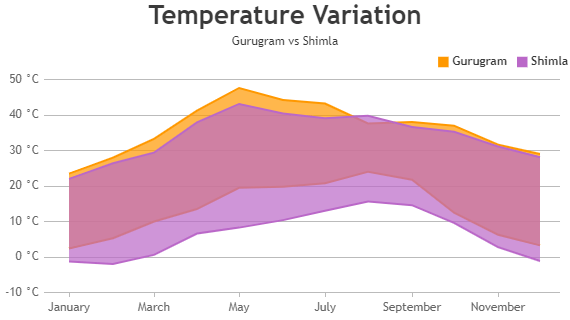
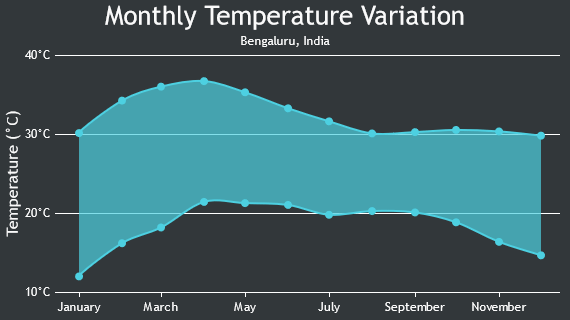
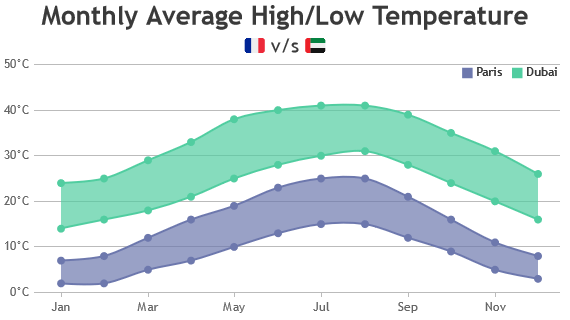
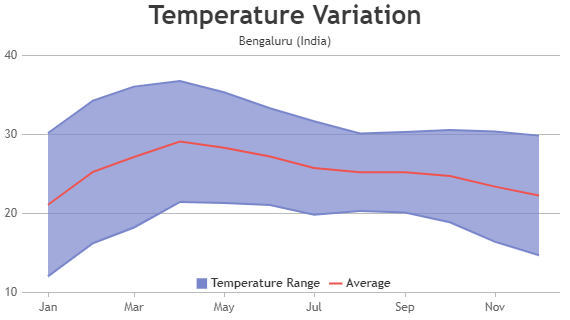
Range Charts in Angular
Angular Chart Component supports Range Column, Range Bar, Range Area, Range Spline Area, etc.

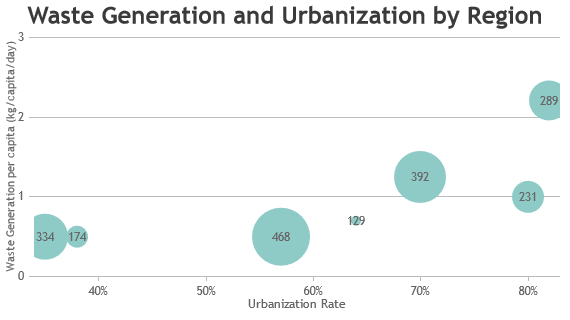
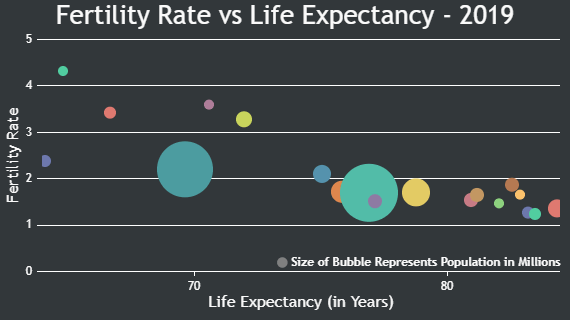
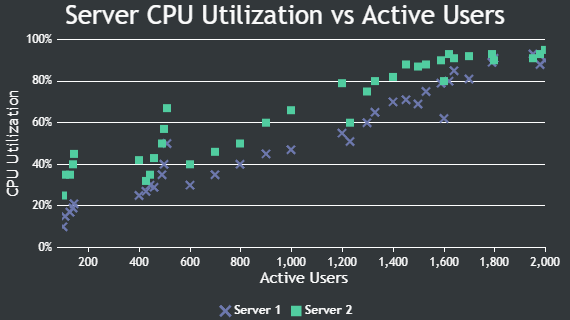
Bubble and Scatter Charts in Angular
Angular Chart Component supports Bubble and Scatter Charts.
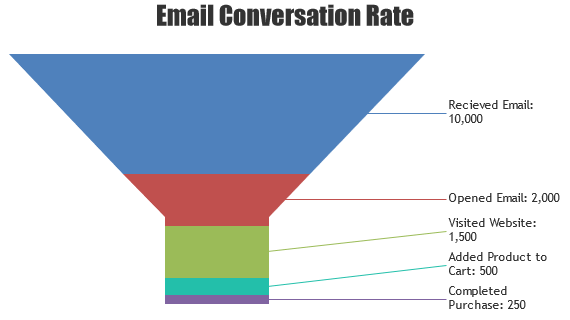
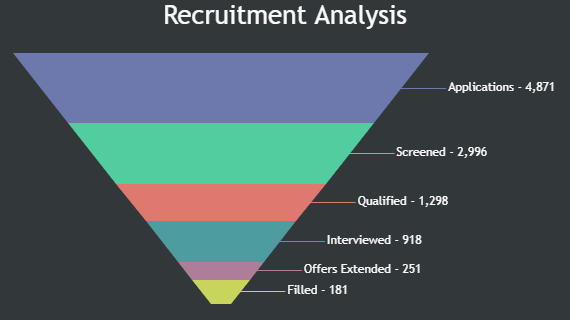
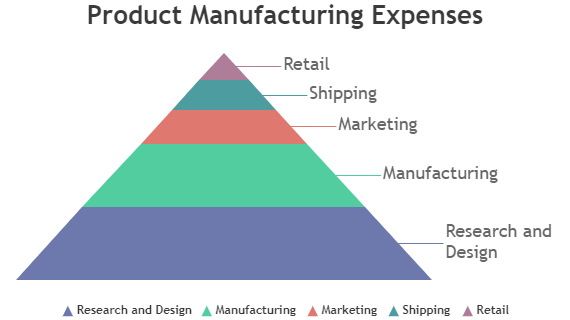
Funnel and Pyramid Charts in Angular
Angular Chart Component supports Funnel & Pyramid Charts.
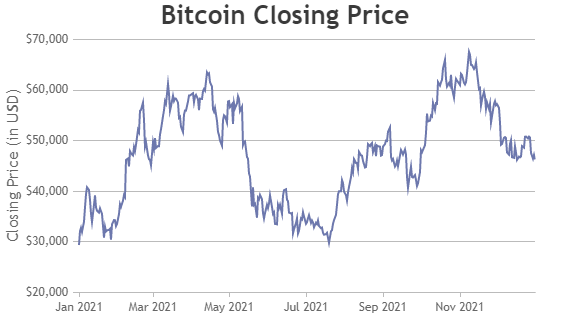
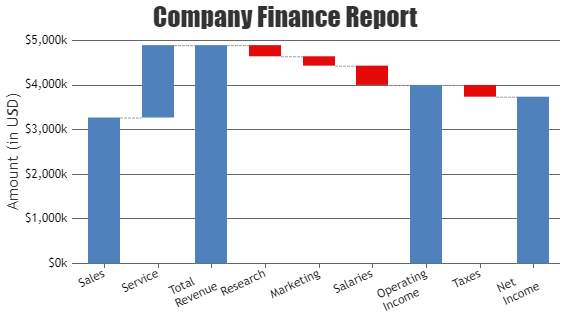
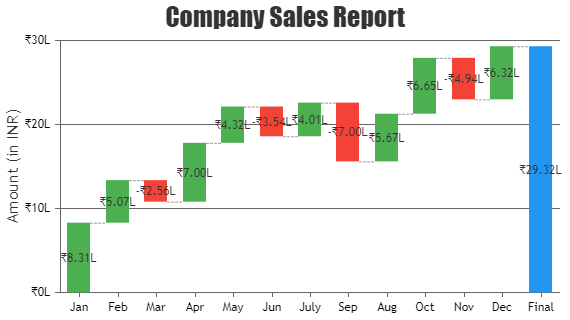
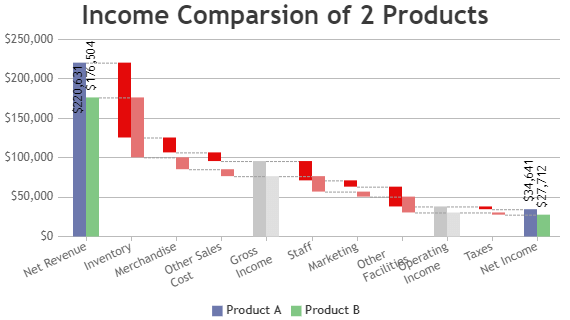
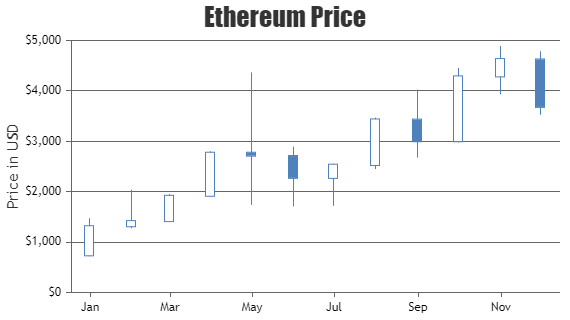
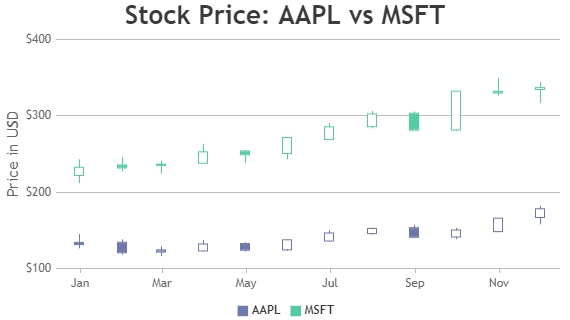
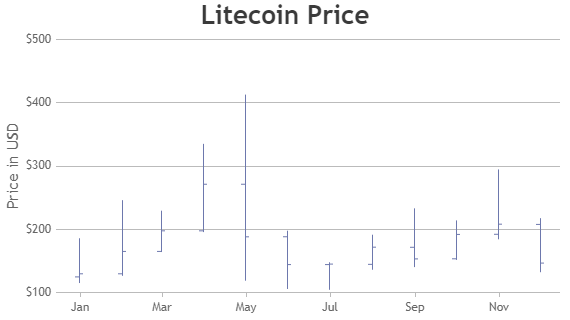
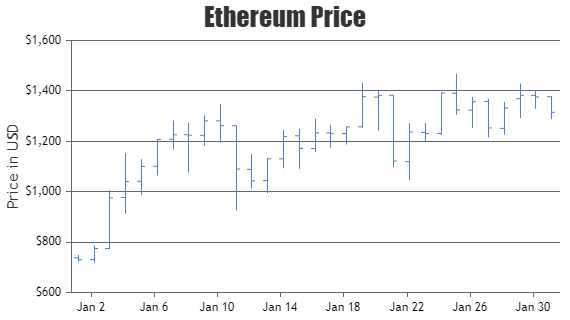
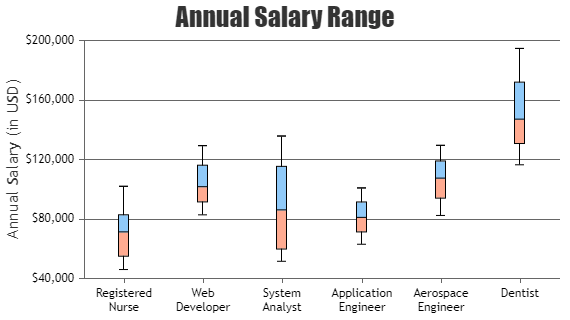
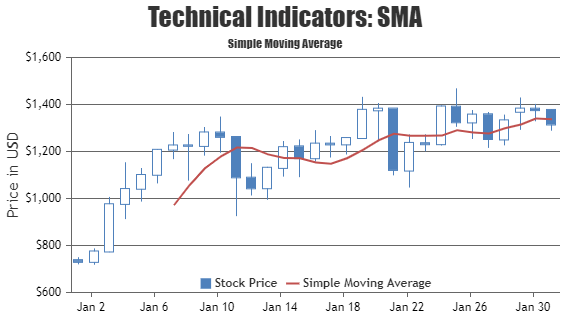
Financial and Advanced Charts in Angular
Angular Chart Component supports Candlestick, OHLC and Box & Whisker Charts.
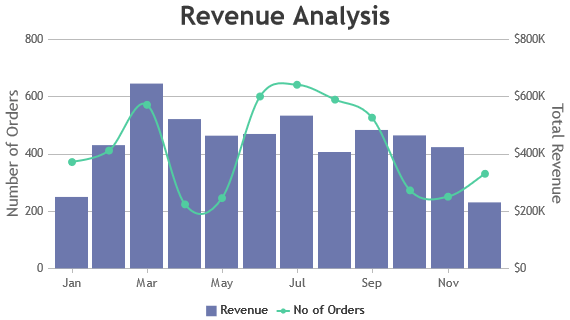
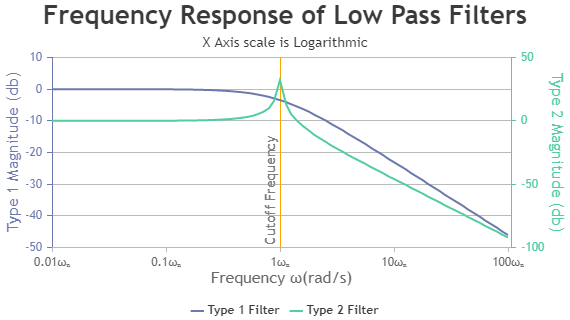
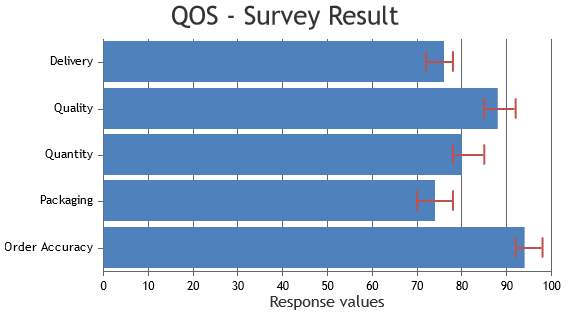
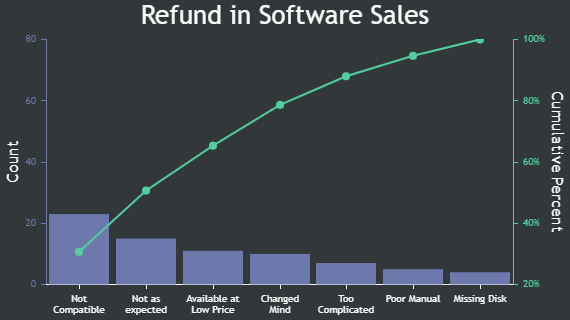
Angular Combination Charts
Angular Chart Component supports Error, Error Line Charts along with combination of many other Charts like Bar, Line, Area, OHLC, etc.
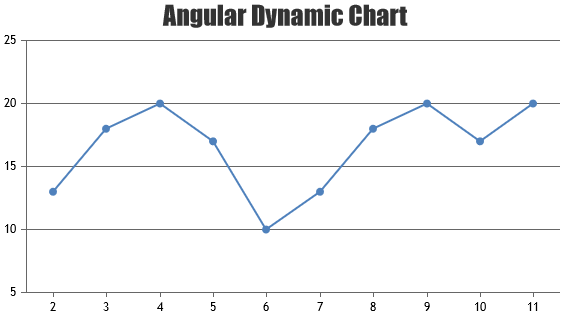
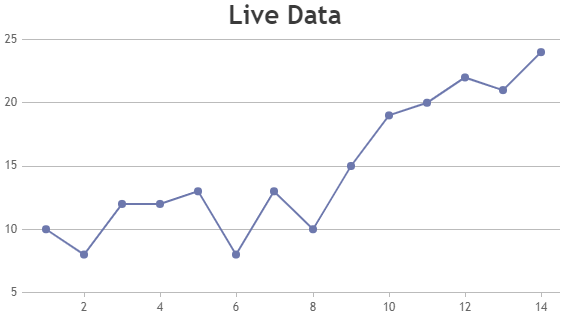
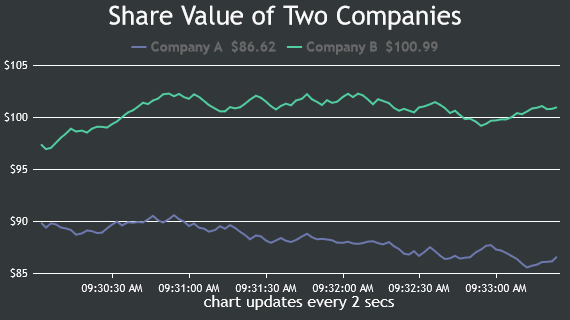
Dynamic Charts in Angular
Angular Chart Component supports Dynamic Charts also known as Real Time or Live Charts.
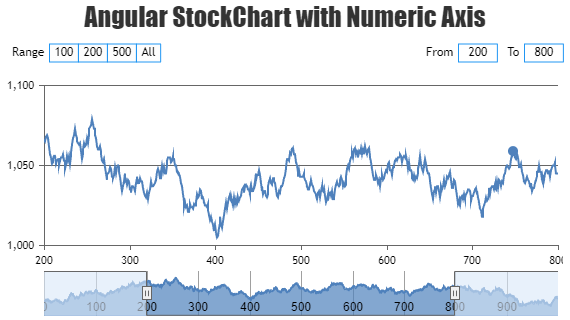
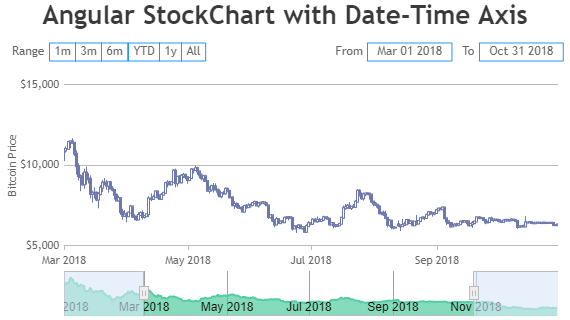
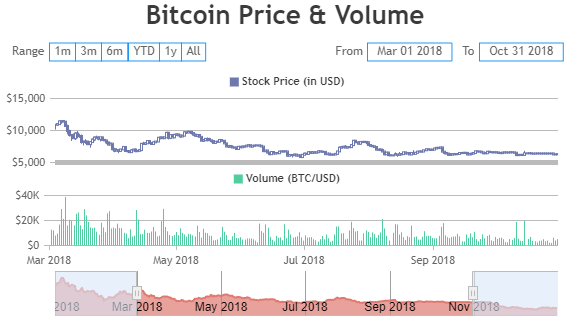
StockCharts in Angular
Angular StockCharts Component supports all Charting features along with Range Selector, Navigator, Multiple Charts, etc.
JavaScript, React, Vue.js, jQuery
Add Responsive & Interactive Chart to your front-end frameworks like JavaScript, React, Vue.js, jQuery etc
Server Side Technologies
Integrates easily with PHP, ASP.NET and many other Libraries and Frameworks.