React Charts & Graphs with 10x Performance
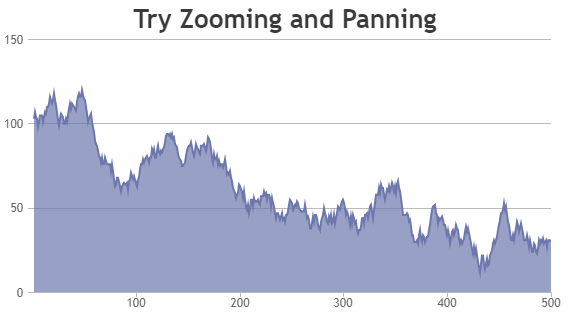
React Charts & Graphs Component with 10x Performance for Web Applications. React Charts are interactive, responsive and support animation, zooming, panning, events, exporting chart as image, drilldown & real-time updates. Library comes with 30+ chart types including line, column, bar, pie, doughnut, range charts, stacked charts, stock charts, etc. With these high performance charts, you can add hundreds of thousands of data points without causing performance lag. Try out below chart examples which are built using our React Charting Component.

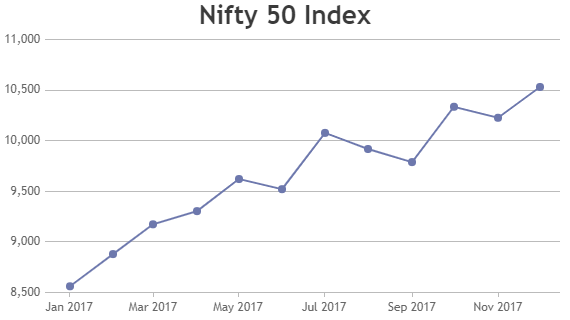


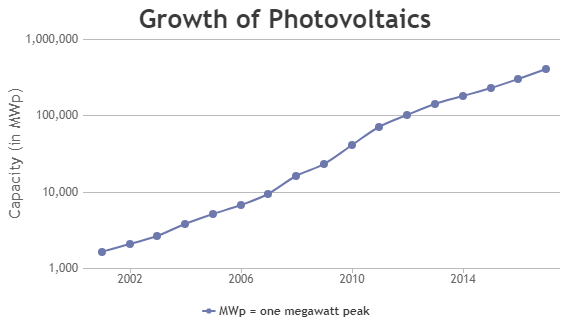
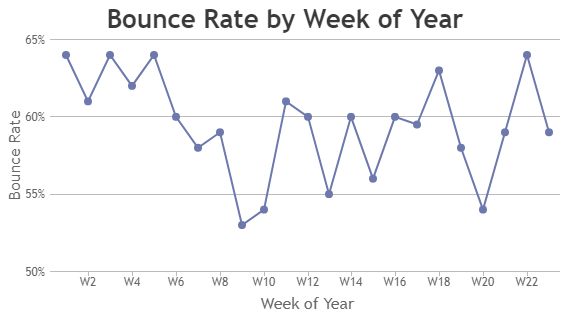
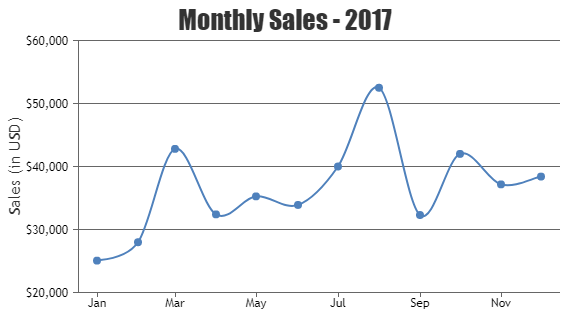
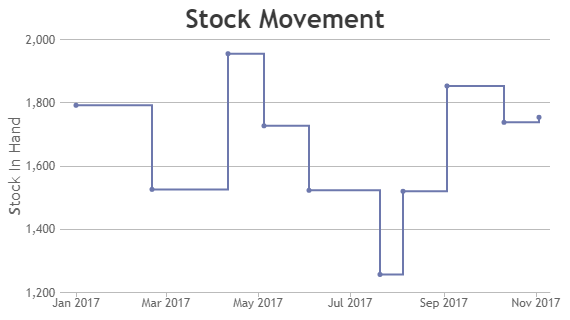
Line Charts in React
React Chart Component supports Line, Spline and Step Line Charts.
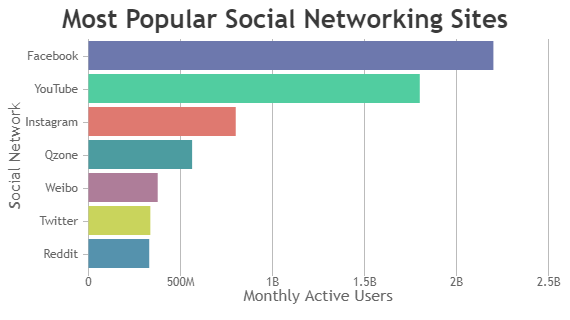
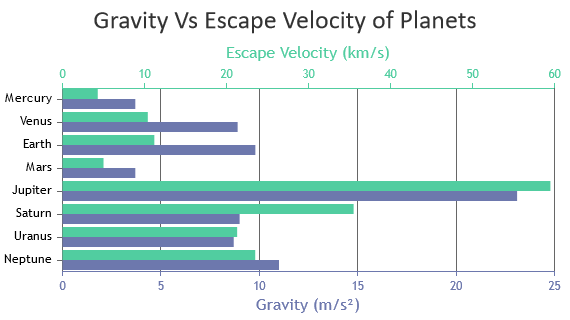
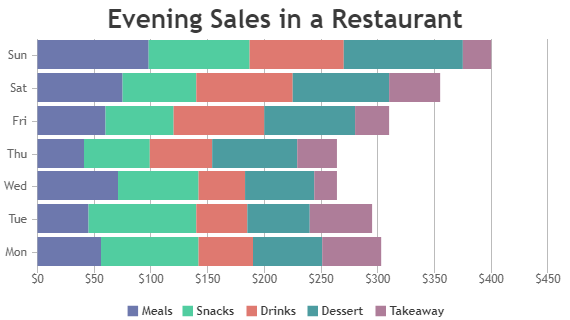
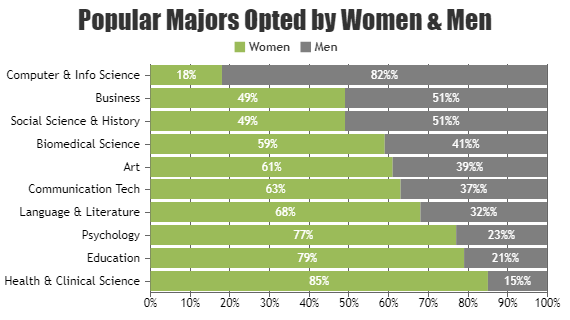
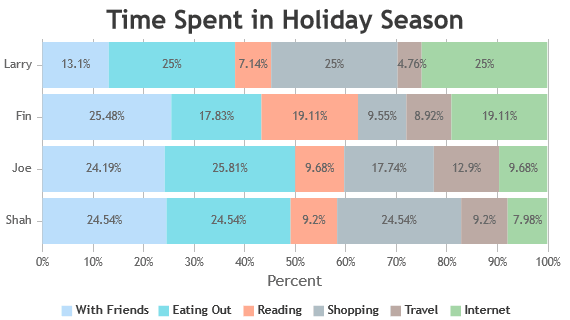
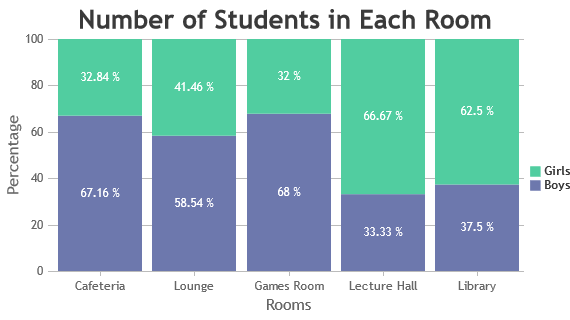
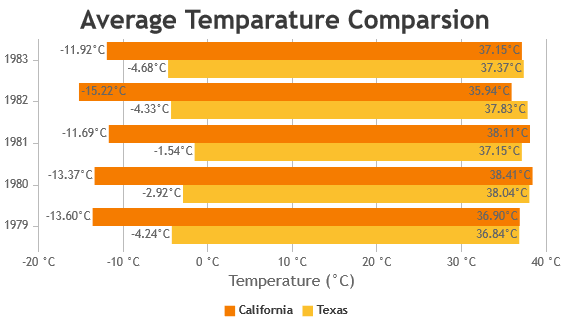
Bar Charts in React
React Chart Component supports Bar, Stacked Bar, Stacked Bar 100% and Range Bar Charts.
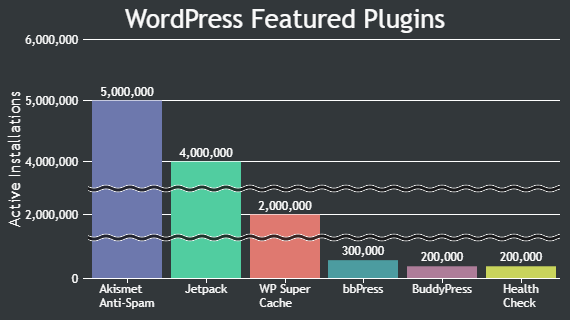
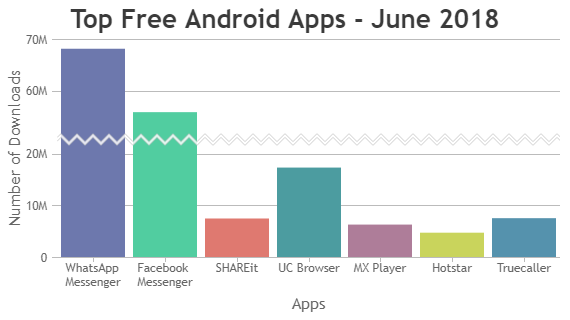
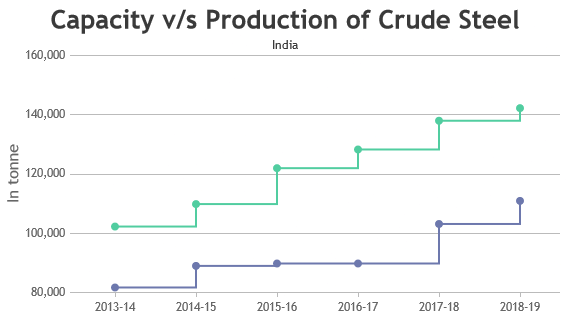
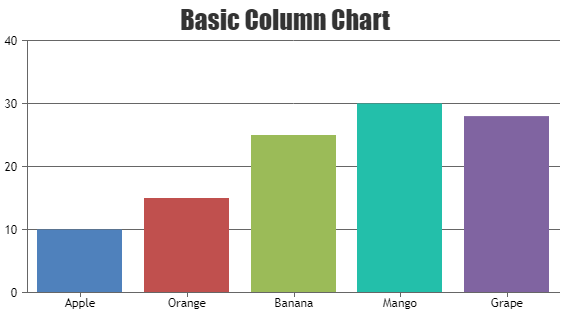
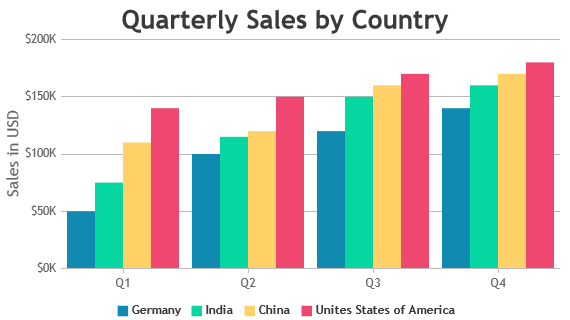
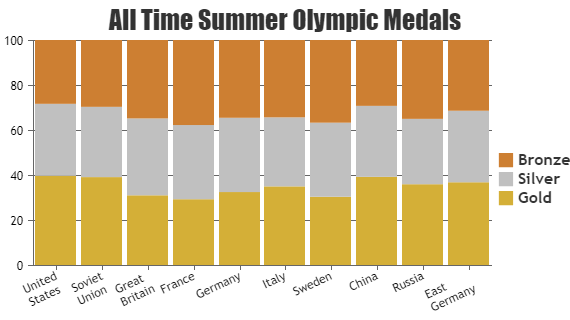
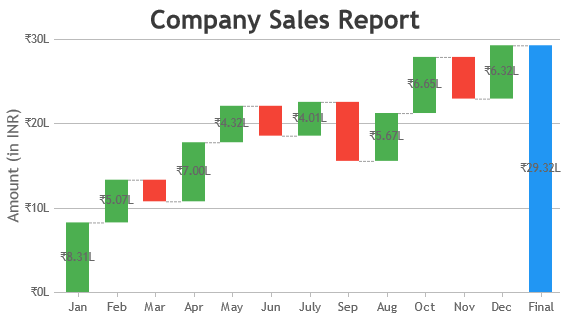
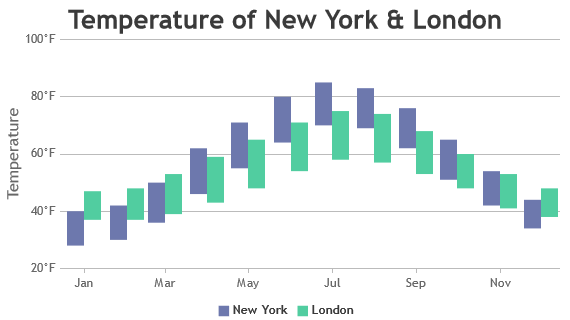
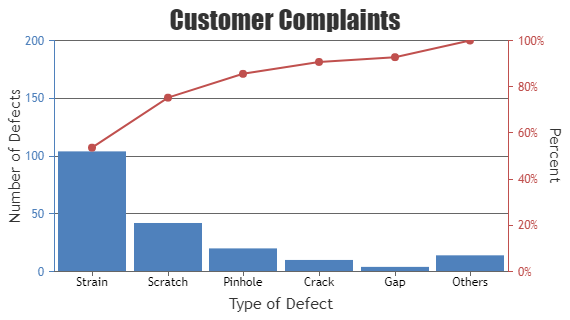
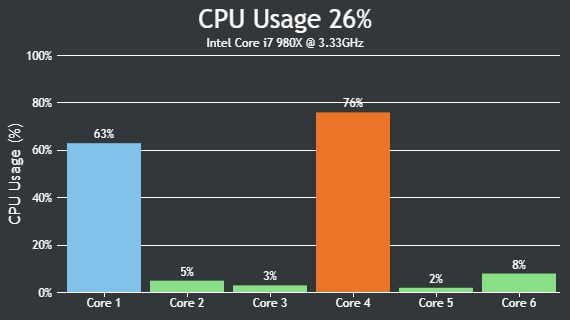
Column Charts in React
React Chart Component supports Column, Stacked Column, Stacked Column 100% and Waterfall Charts.

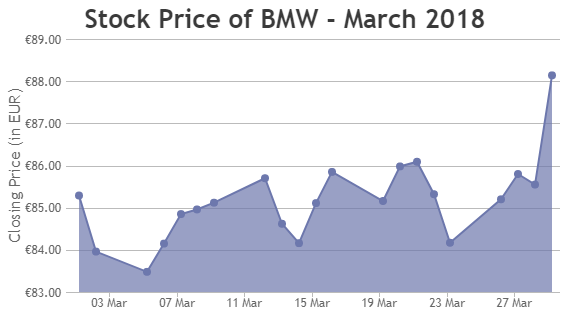
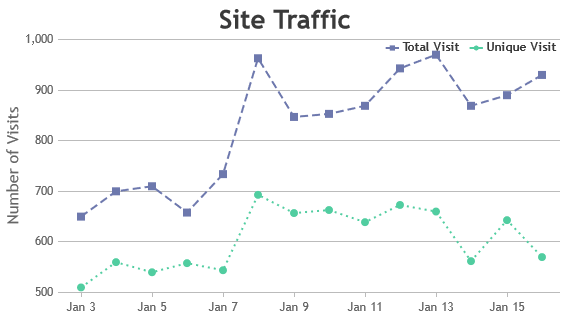
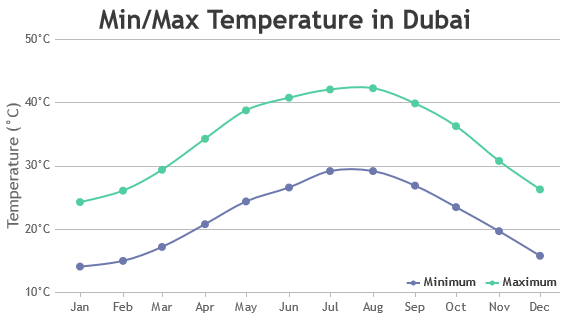
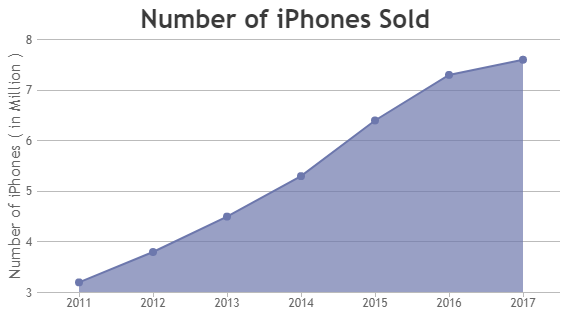
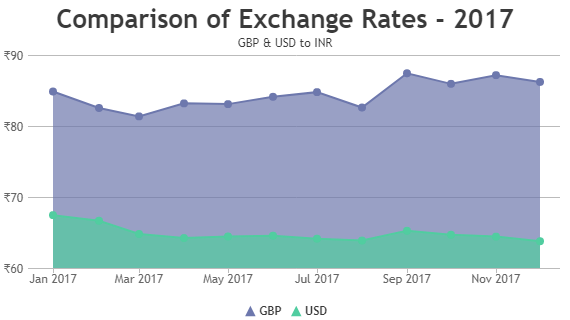
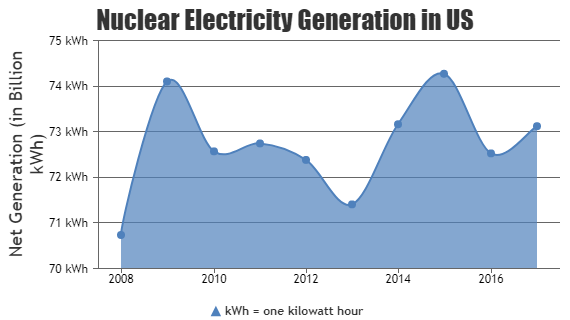
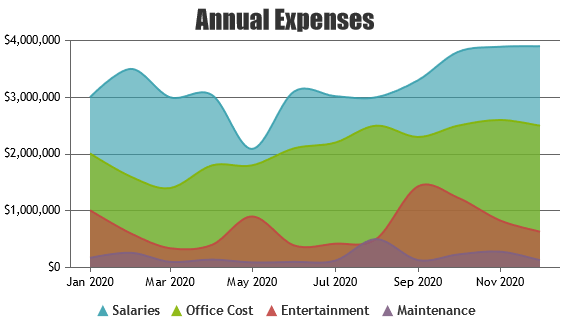
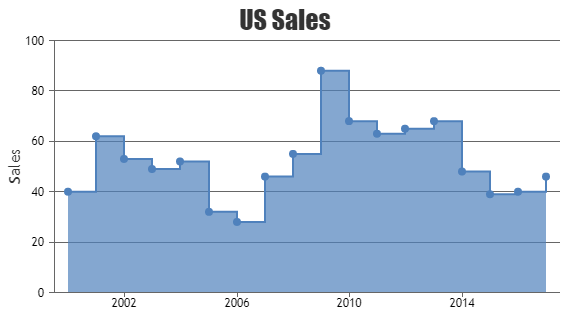
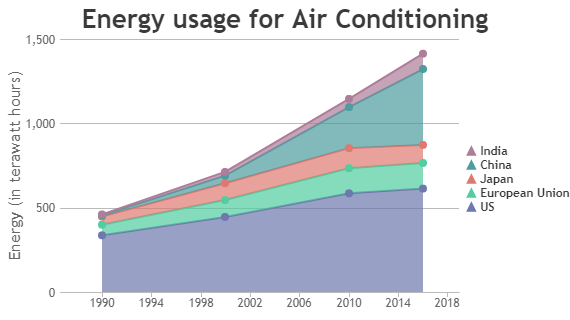
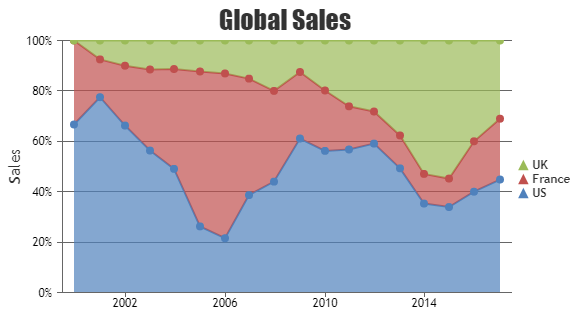
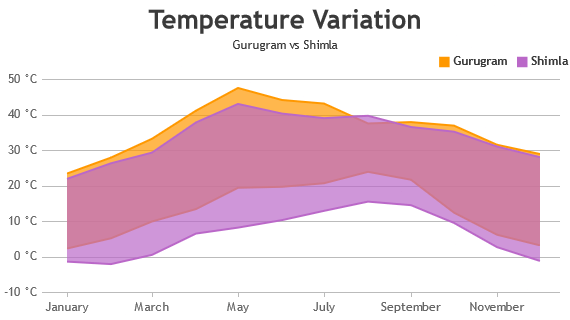
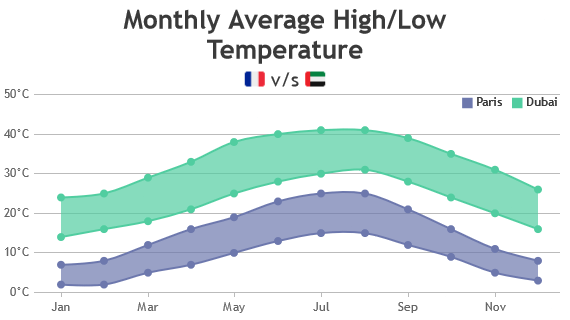
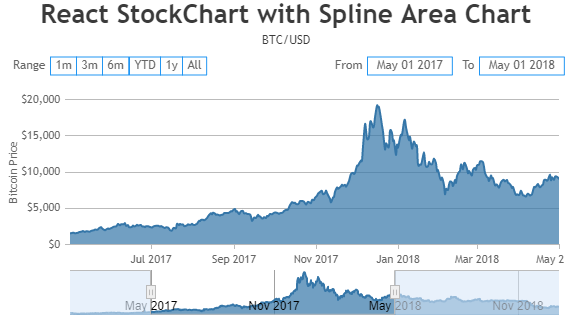
Area Charts in React
React Chart Component supports Area, Spline Area, Stacked Area, Stacked Area 100, Step Area, Range Area and Range Spline Area Charts.
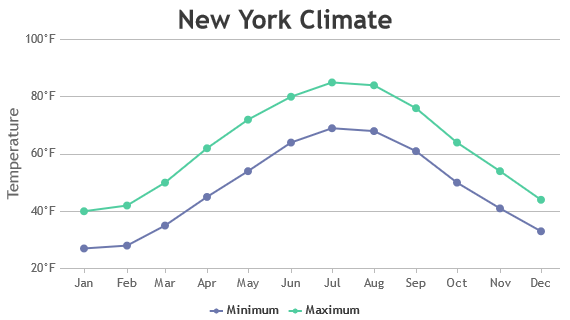
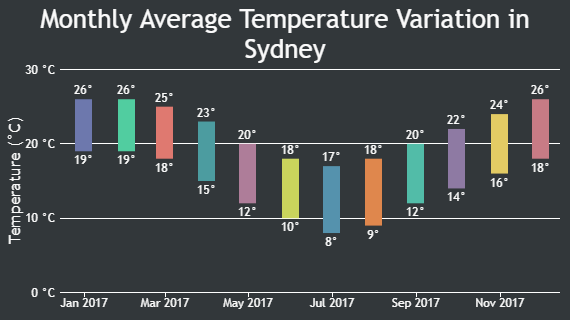
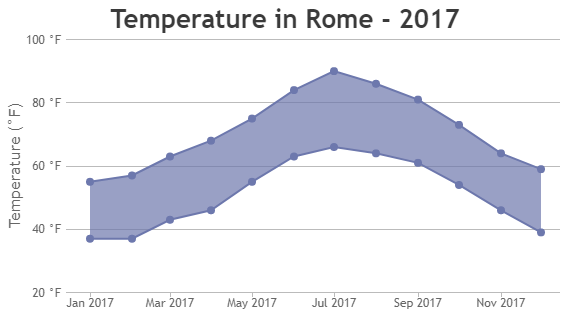
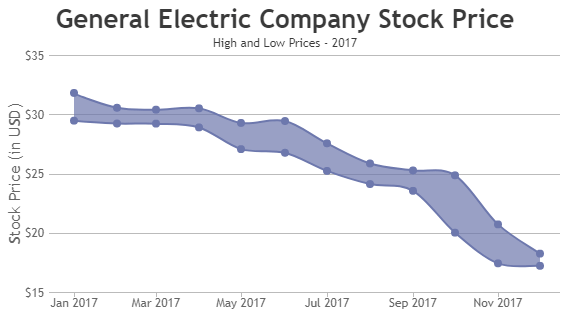
Range Charts in React
React Chart Component supports Range Column, Range Bar, Range Area and Range Spline Area Charts.

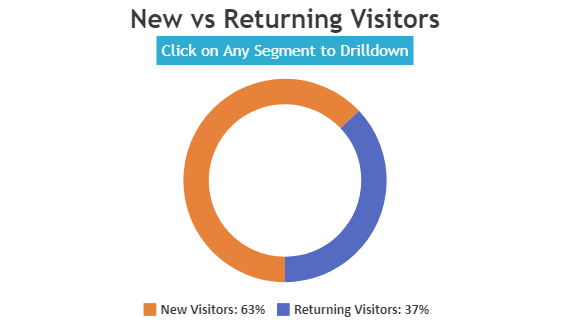
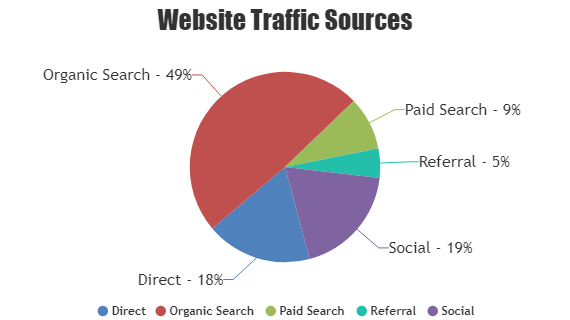
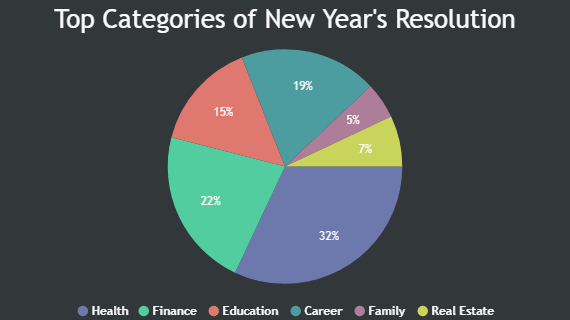
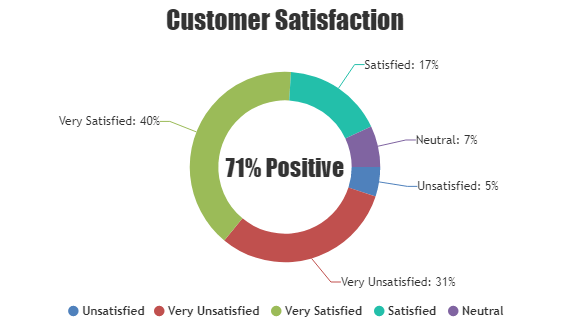
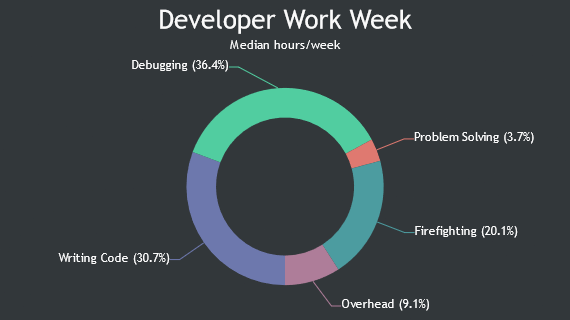
Pie and Doughnut Charts in React
React Chart Component supports Pie & Doughnut / Donut Charts.
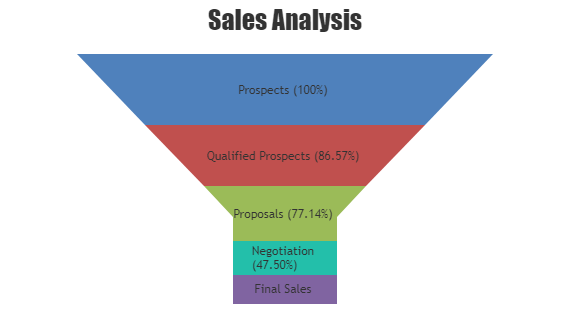
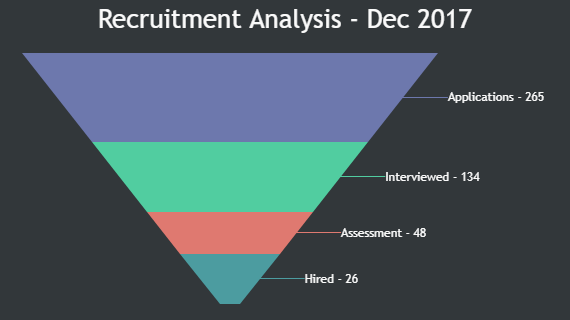
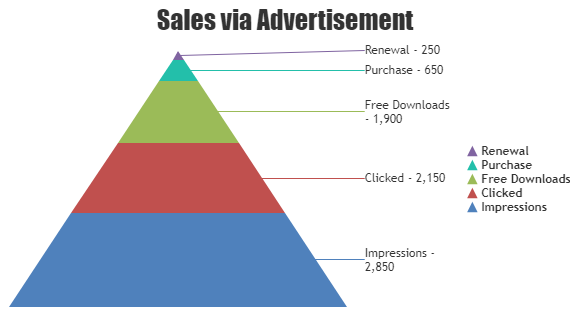
Funnel and Pyramid Charts in React
React Chart Component supports Funnel and Pyramid Charts.
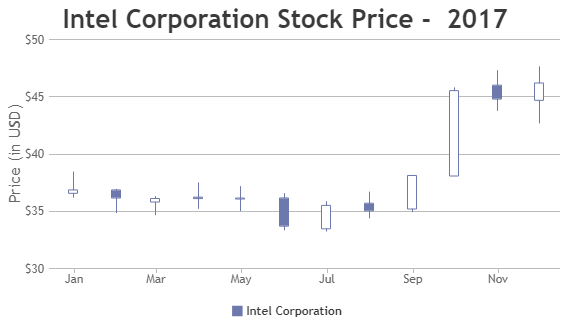
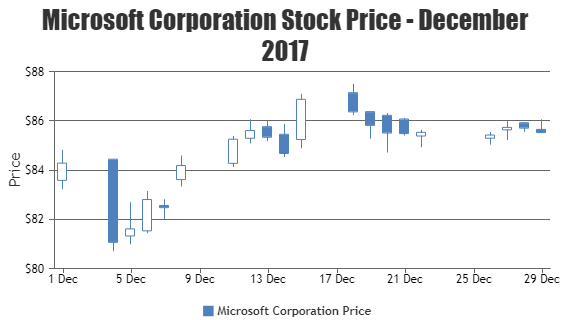
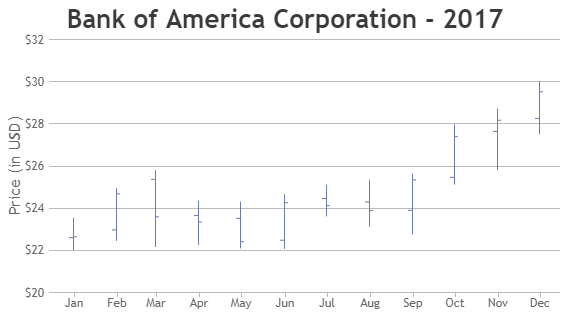
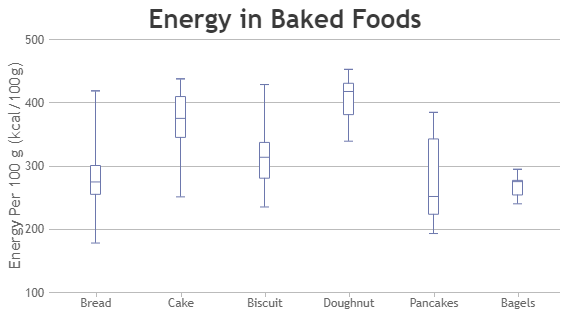
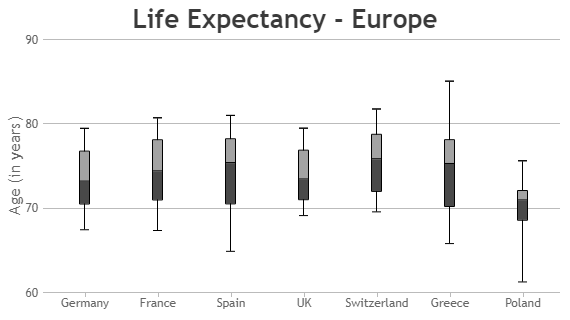
Financial Charts in React
React Chart Component supports Candlestick, OHLC and Box & Whisker Charts.
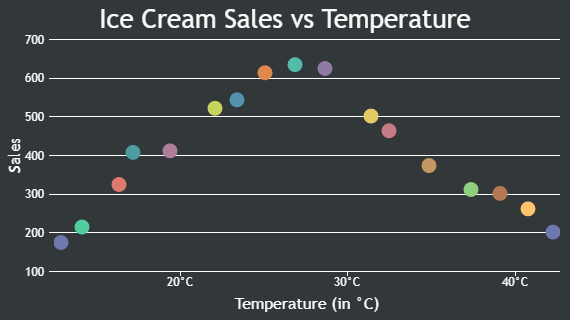
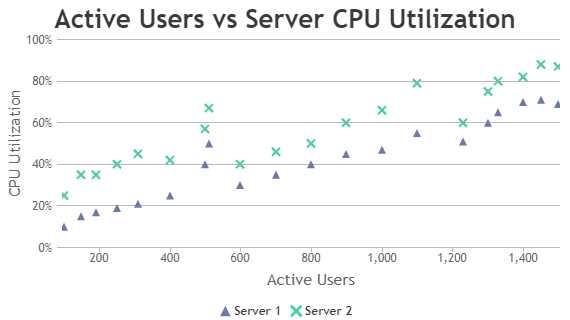
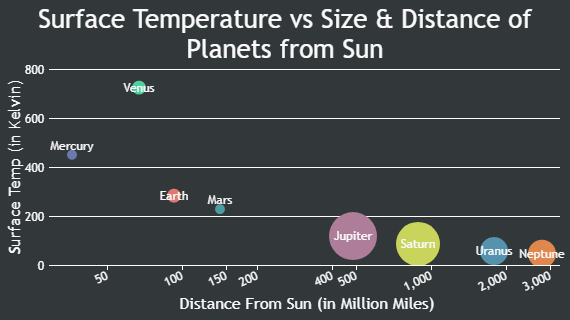
Scatter and Bubble Charts in React
React Chart Component supports Scatter and Bubble Charts.
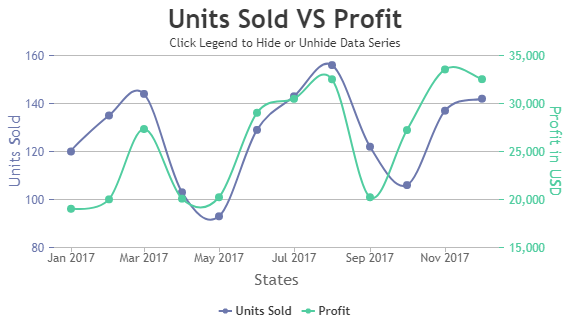
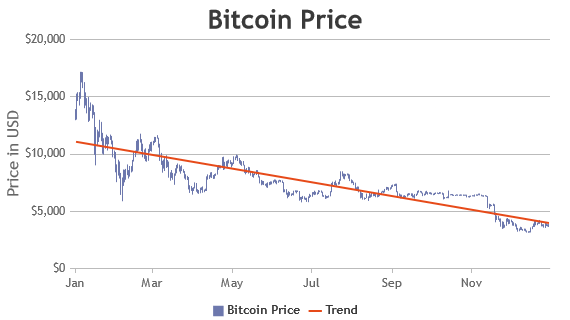
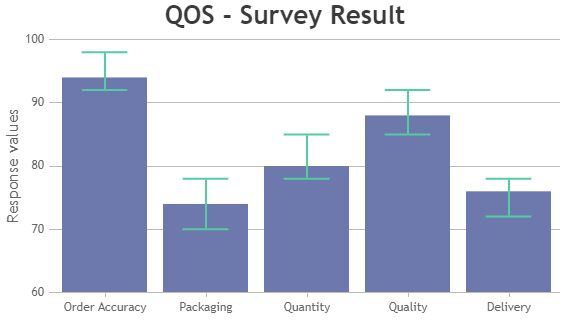
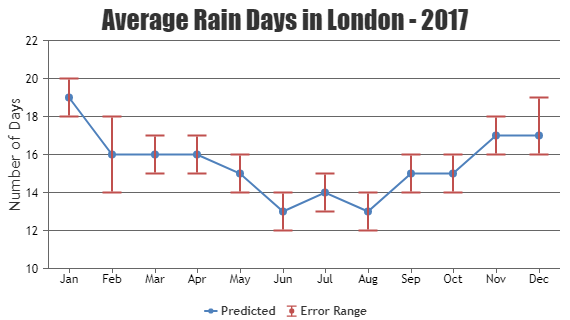
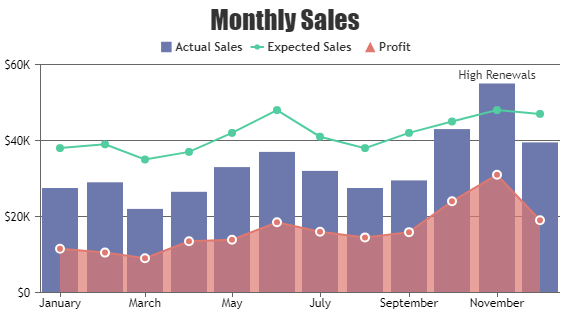
Combination of Charts in React
React Chart Component supports Error, Error Line Charts along with combination of many other Charts like Bar, Line, Area, OHLC, etc.
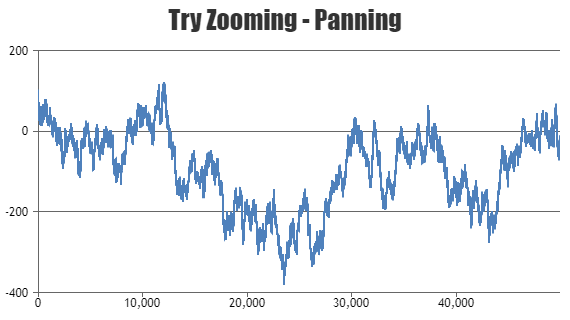
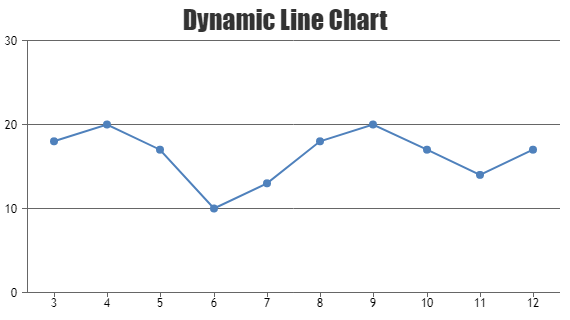
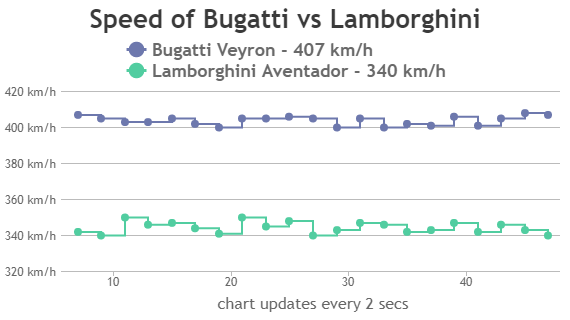
Dynamic Charts in React
React Chart Component supports Dynamic Charts also known as Real Time or Live Charts.
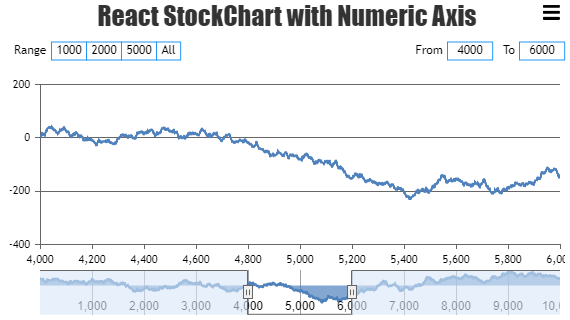
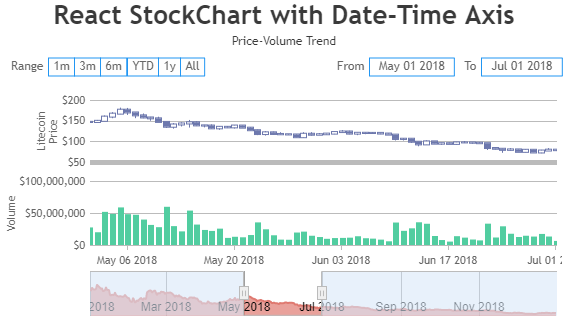
StockCharts in React
React StockCharts Component supports all Charting features along with Range Selector, Navigator, Multiple Charts, etc.
Angular, Vue.js, JavaScript, jQuery
Add Responsive & Interactive Chart to your front-end frameworks like Angular, Vue.js, jQuery etc.
Server Side Technologies
Integrates easily with PHP, ASP.NET and many other Libraries and Frameworks.