jQuery Charts & Graphs
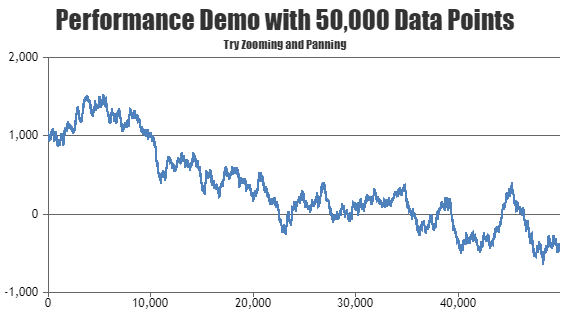
jQuery Charting Plugin lets you add interactive charts & graphs to your web page with just a few lines of code. Charts are responsive & integrate easily with Bootstrap & popular JavaScript Frameworks. You have access to all the features present in standalone version including features like dynamic updates, zoom, pan, exporting as image, etc. This jQuery Library supports 30 different Chart types including Line, Bar, Pie, etc. If you are someone who uses jQuery extensively, you should feel right at home with this plugin. Charts have high performance which allows you to plot tens of thousands of data points without any lag.
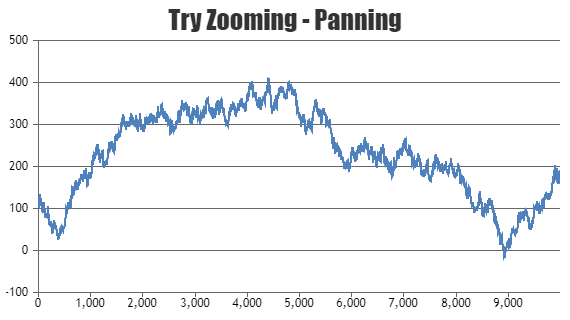
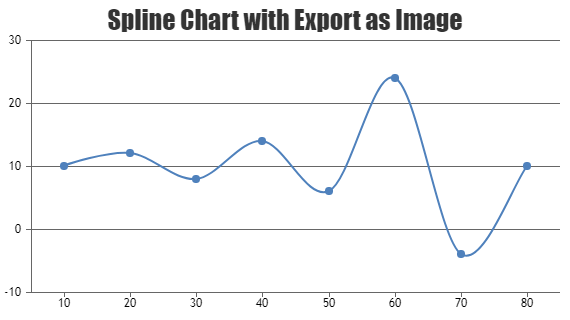
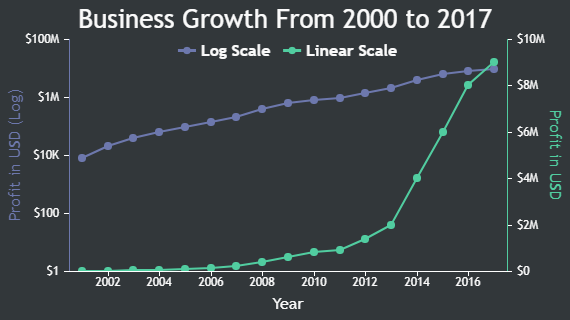
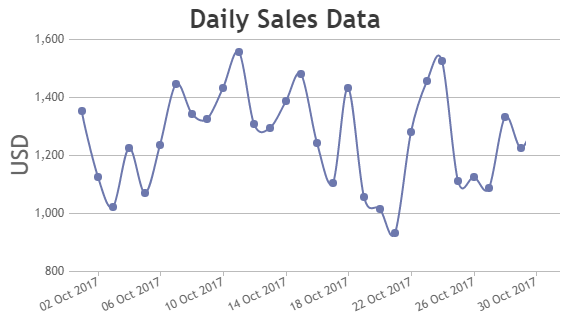
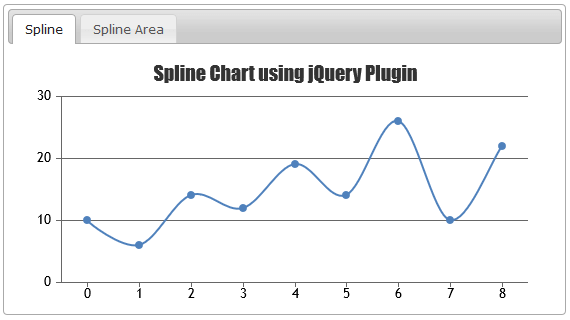
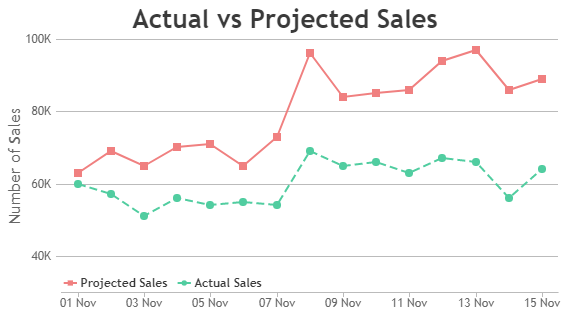
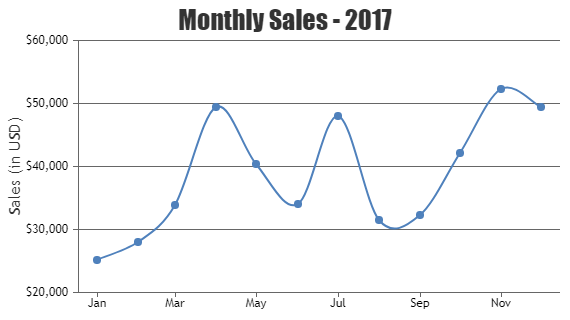
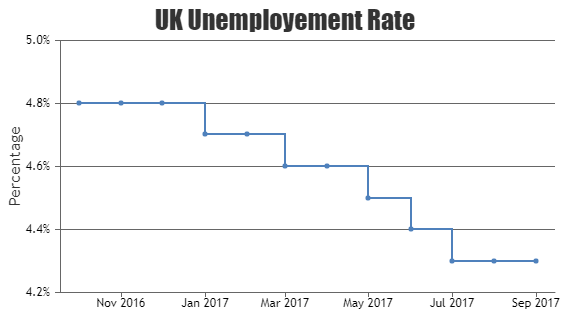
Line Charts in jQuery
jQuery Charting Plugin supports Line, Spline and Step Line Charts.
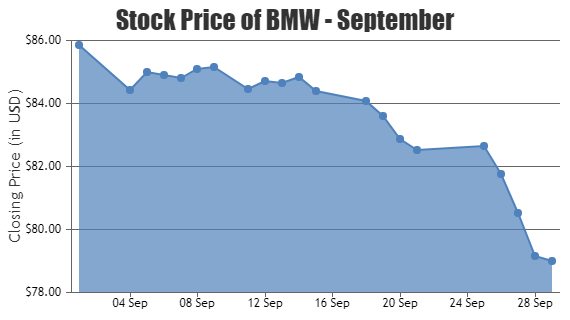
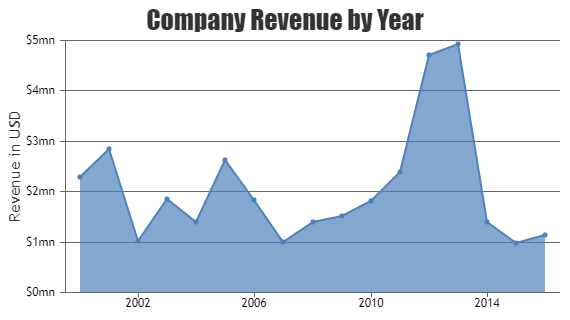
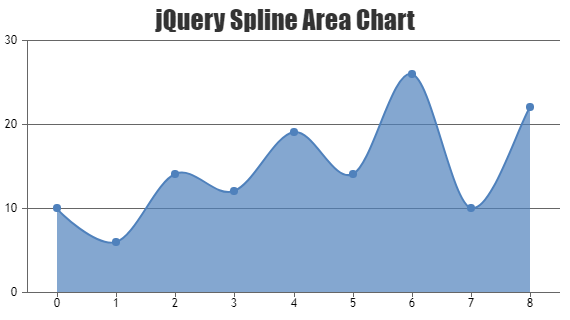
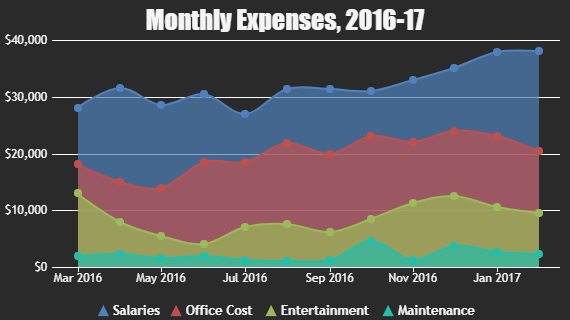
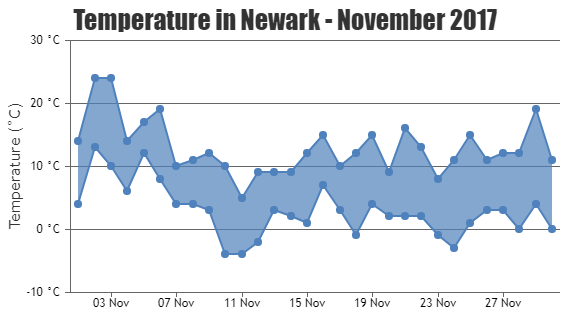
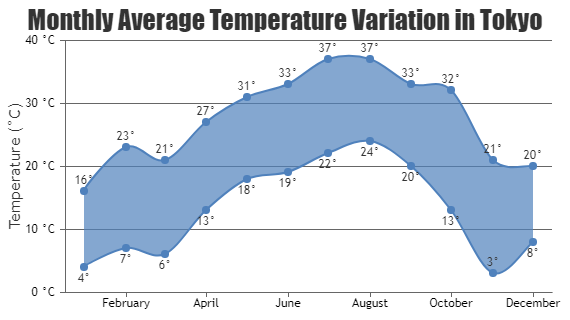
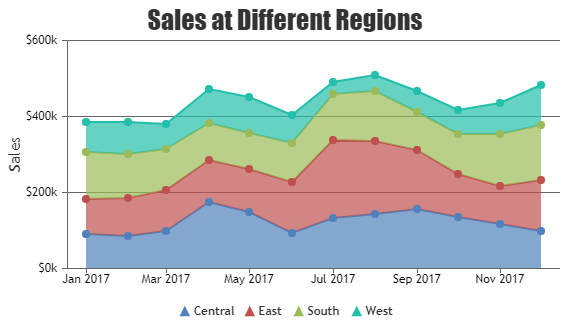
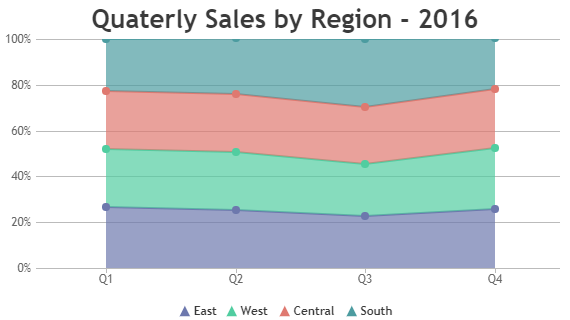
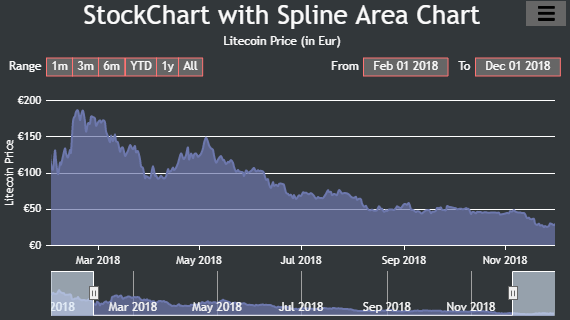
Area Charts in jQuery
jQuery Charting Library supports Area, Spline Area, Stacked Area, Stacked Area 100, Step Area, Range Area and Range Spline Area Charts.

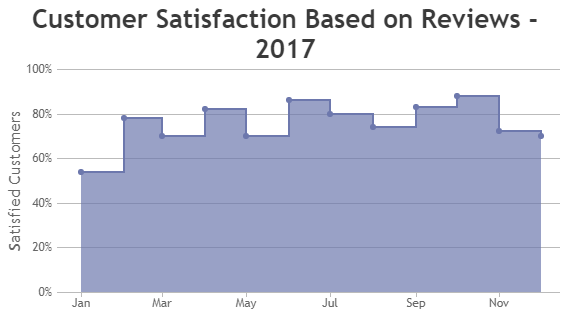
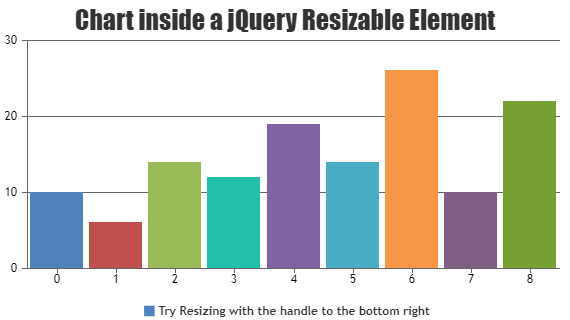
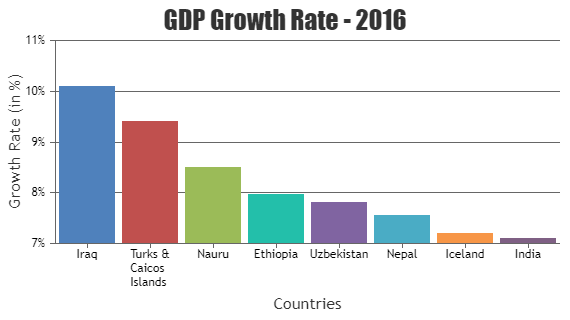
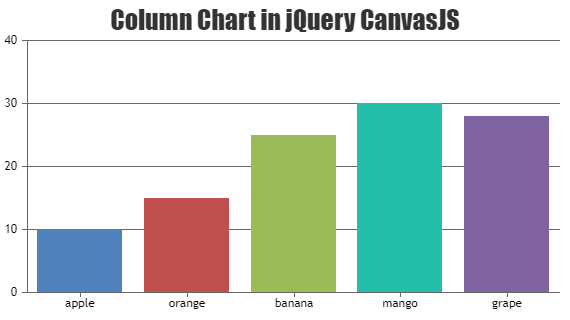
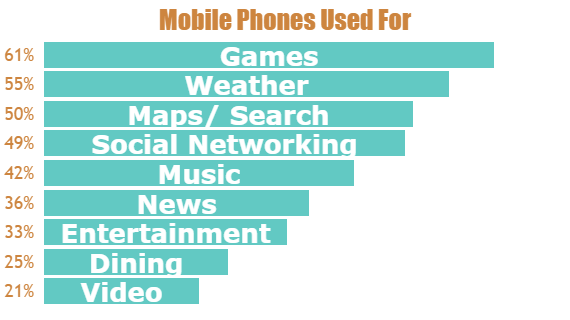
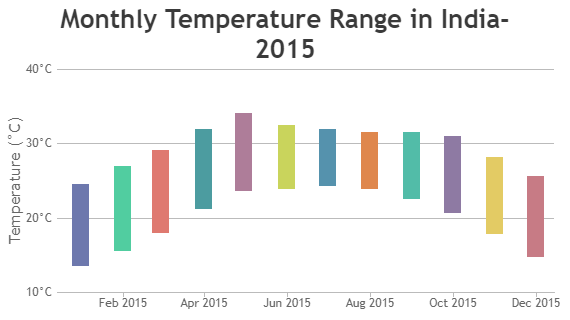
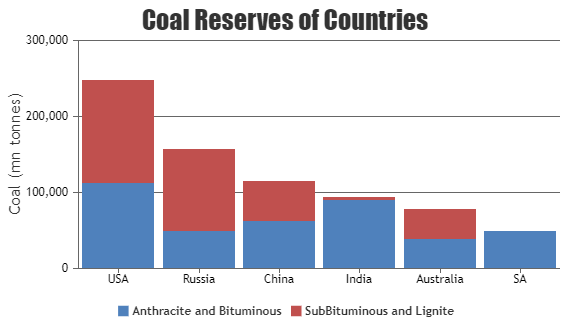
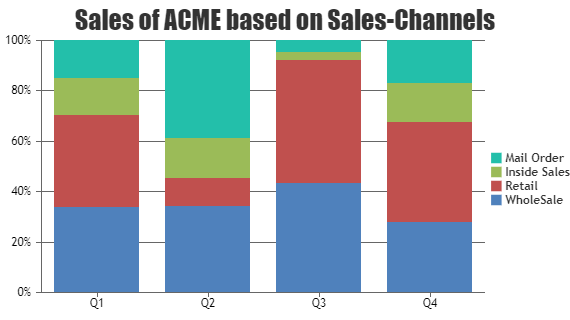
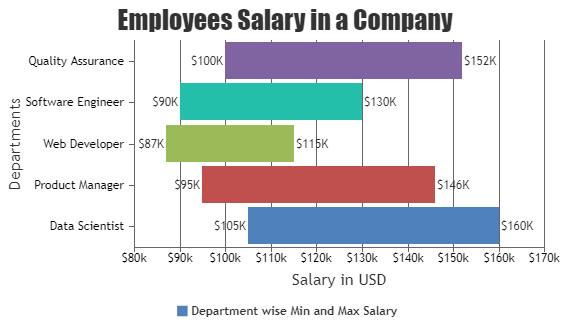
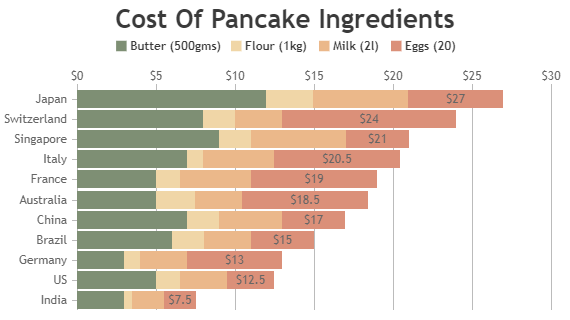
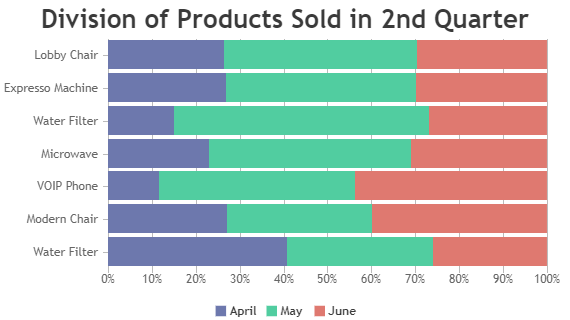
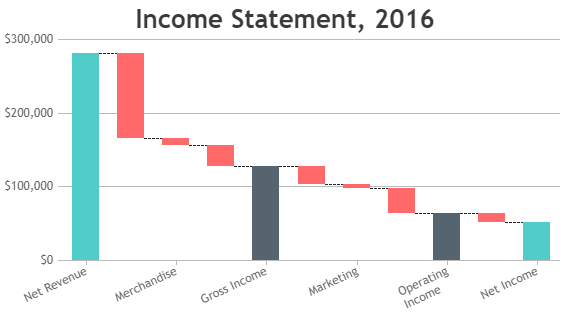
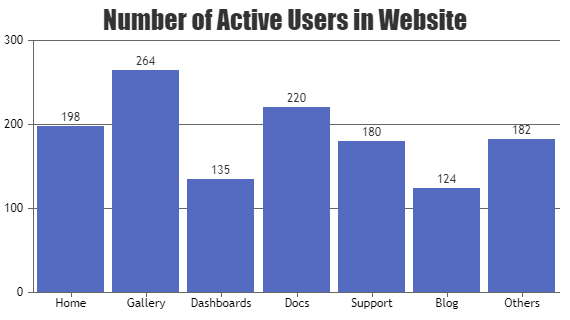
Column & Bar Charts in jQuery
jQuery Charting Library supports Column, Bar, Stacked Column, Stacked Column 100%, Range Column, Stacked Bar, Stacked Bar 100%, Range Bar and Waterfall Charts.
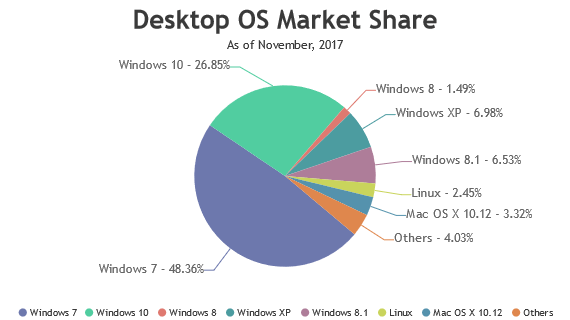
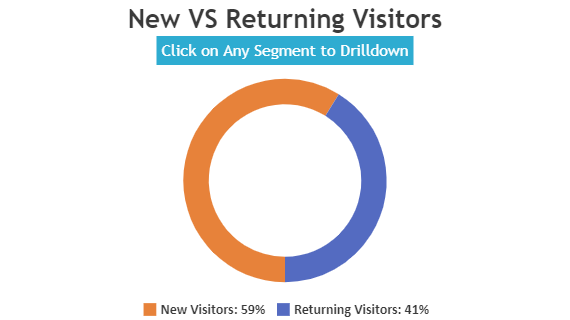
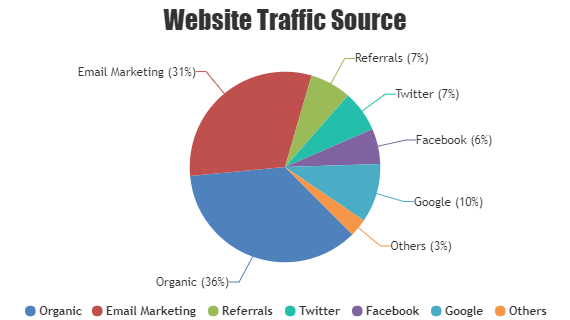
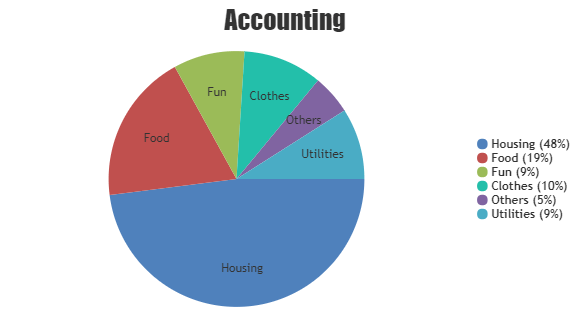
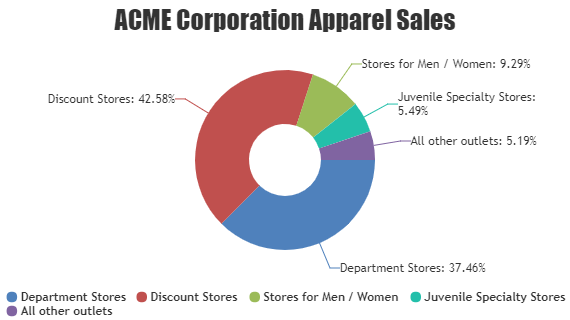
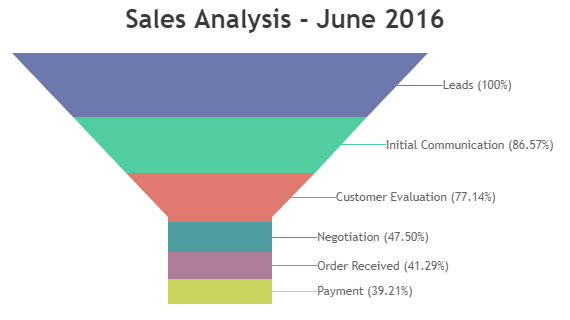
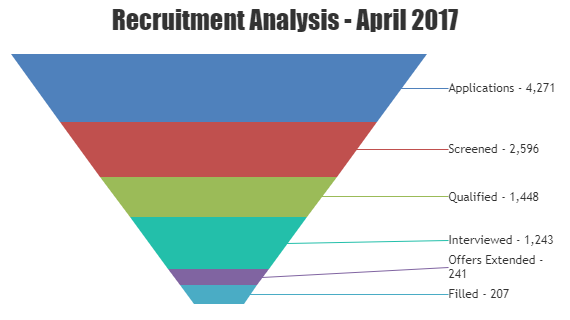
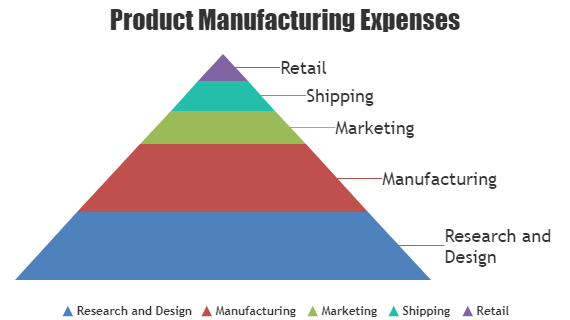
Pie & Funnel Charts in jQuery
jQuery Charting Plugin supports Pie, Doughnut / Donut, Funnel and Pyramid Charts.
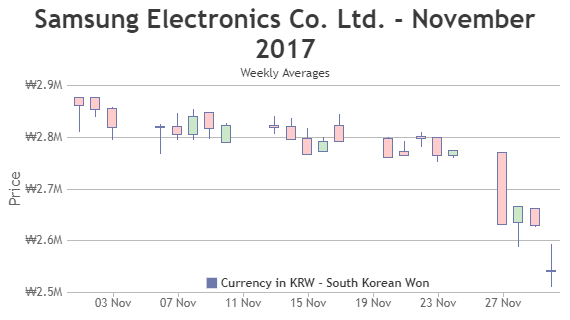
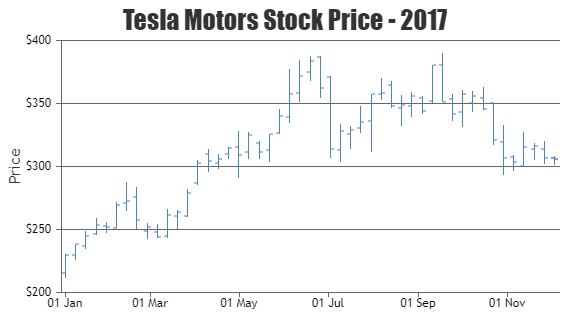
Financial Charts in jQuery
jQuery Charting Library supports Candlestick and OHLC Charts.

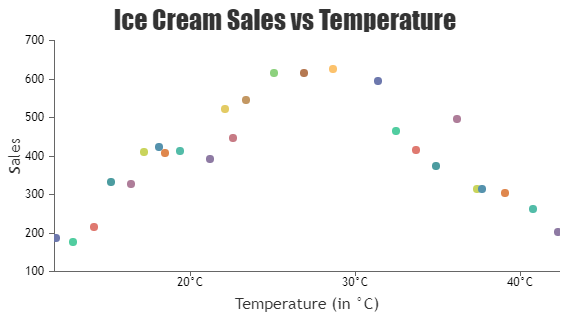
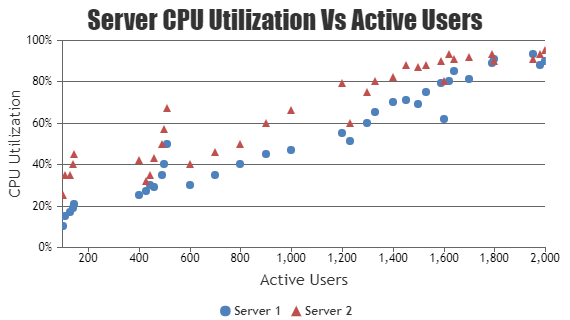
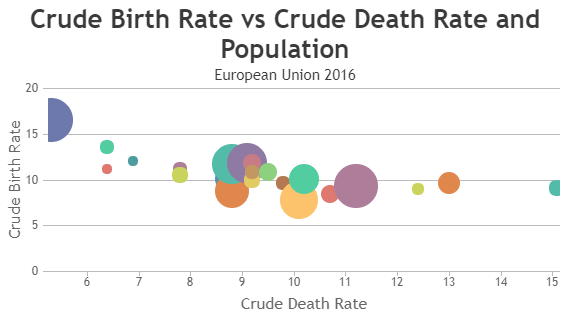
Scatter & Bubble Charts in jQuery
jQuery Charting Library supports Scatter and Bubble Charts.
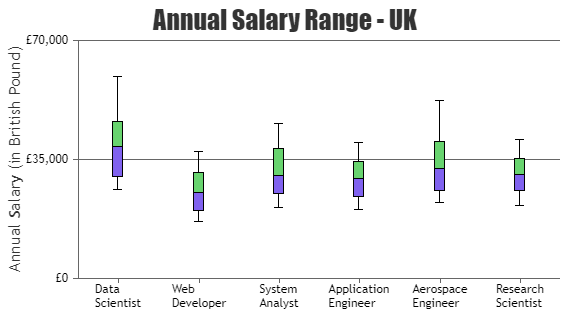
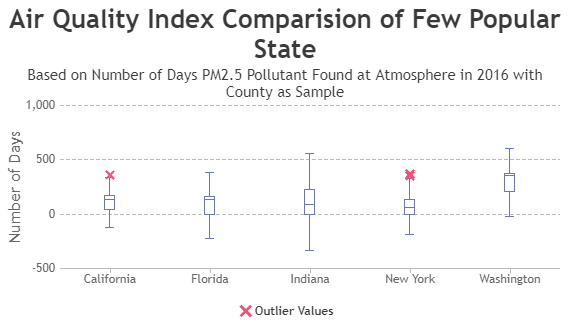
Box & Whisker Charts in jQuery
Supports Box & Whisker Charts – also Known as Box Plot Charts.
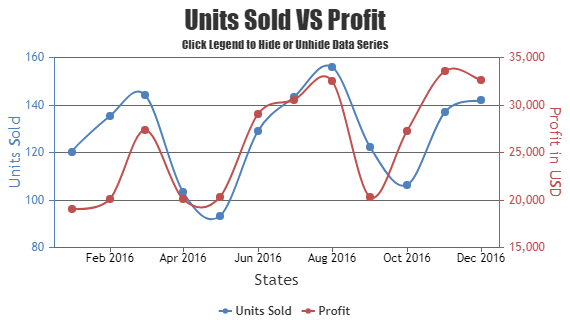
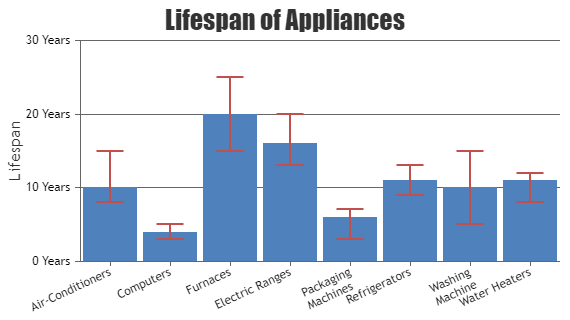
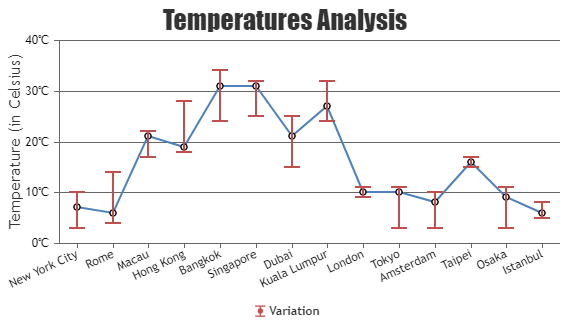
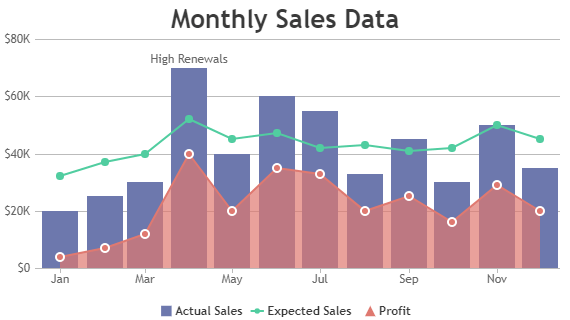
Combination Charts in jQuery
Supports Error, Error Line Charts along with combination of many other Charts like Bar, Line, Area, OHLC, etc.
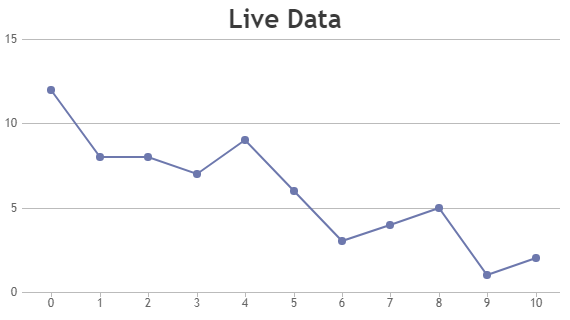
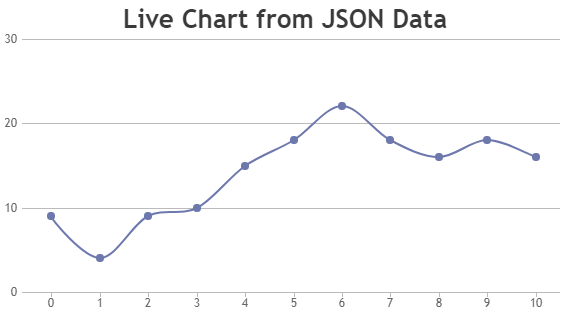
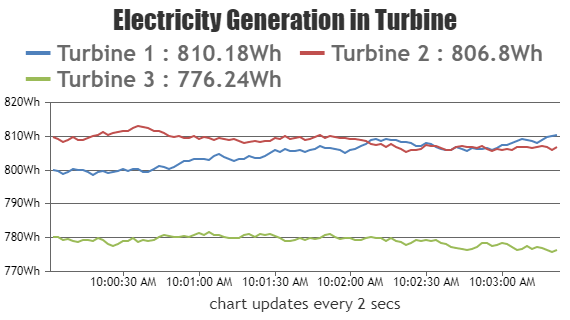
Dynamic Charts in jQuery
jQuery Charting Library supports Dynamic Charts – also known as Real Time or Live Charts.
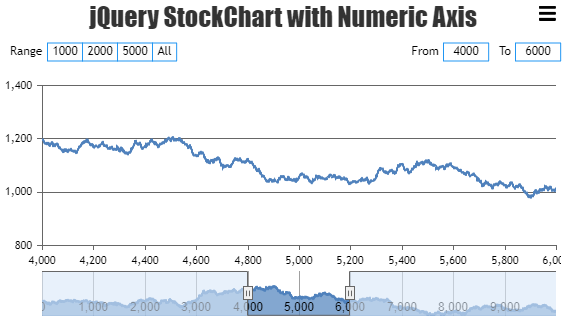
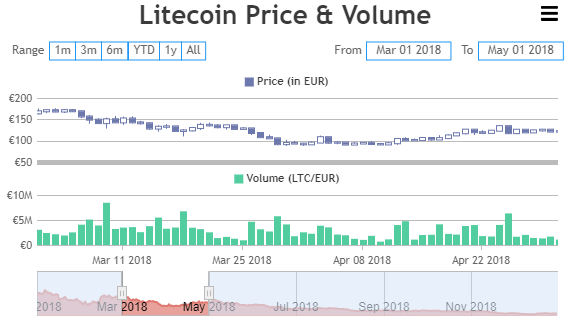
StockCharts in jQuery
StockCharts with Range Selector & Navigator.
React, Angular, Vue.js, jQuery
Add Responsive & Interactive Chart to your front-end frameworks like React, Angular, Vue.js, etc.
Server Side Technologies
Integrates easily with PHP, ASP.NET and many other Libraries and Frameworks.