CanvasJS StockChart v1.16.4 GA Released
Today, we are releasing CanvasJS StockChart v1.16.4 GA, which includes a few bug fixes related to range buttons. Below is a summary of this release. StockChart Release Update Bug Fixes The set method was not working for the default range buttons. Do download the latest version from our download page and
CanvasJS Chart v3.16.3 & StockChart v1.16.3 GA Released
Today, we are releasing CanvasJS Chart v3.16.3 & StockChart v1.16.3 GA, which include a few bug fixes related to toolTipContent and rangeselector. Below is a summary of this release. Chart Release Update Bug Fixes Setting toolTipContent to null hid the tooltip, but it also prevented the datapoint from being highlighted. StockChart
CanvasJS StockChart v1.16.2 GA Released
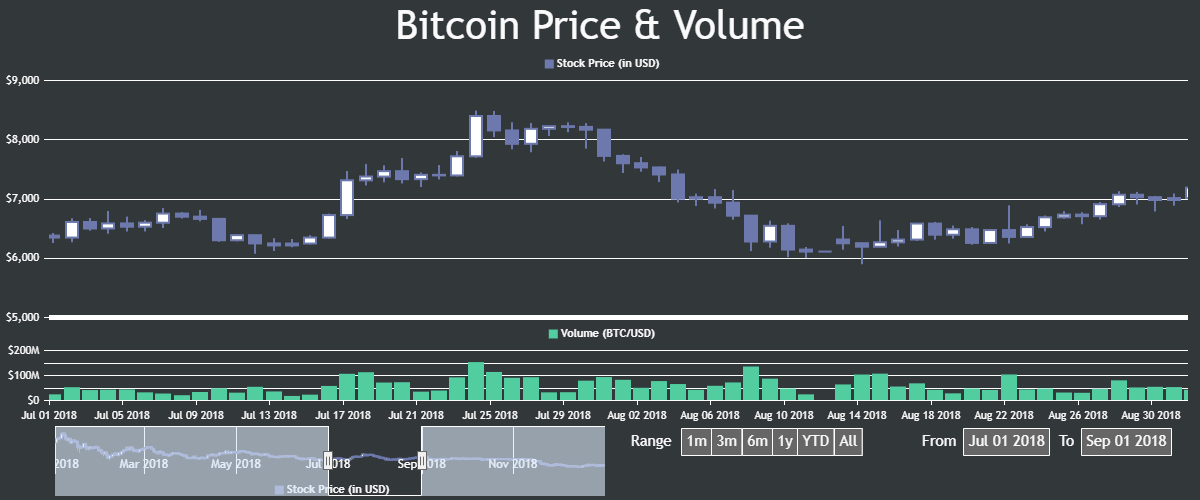
Today, we are releasing CanvasJS StockChart v1.16.2 GA, which includes a few improvements related to navigator and rangeselector. Below is a summary of this release. StockChart Release Update Improvements & Enhancements Added support for side-by-side positioning of the Navigator and RangeSelector when their combined width is smaller than the StockChart width and
CanvasJS Chart v3.16.1 & StockChart v1.16.1 GA Released
Today, we are releasing CanvasJS Chart v3.16.1 & StockChart v1.16.1 GA, which include a few bug fixes related to axis. Below is a summary of this release. Chart & StockChart Release Update Bug Fixes In some cases, axis reserved unnecessary space despite the labels being placed inside – across axisX, axisX2, axisY
CanvasJS Chart v3.16.0 & StockChart v1.16.0 GA Released
Today, we are releasing CanvasJS Chart v3.16.0 & StockChart v1.16.0 GA, which include features related to stripline label along with a few bug fixes. Below is a summary of this release. Chart & StockChart Release Update Features & Improvements Added labelAngle property to striplines that allows you to adjust the angle of
CanvasJS Chart v3.16.0 & StockChart v1.16.0 Beta 1 Released
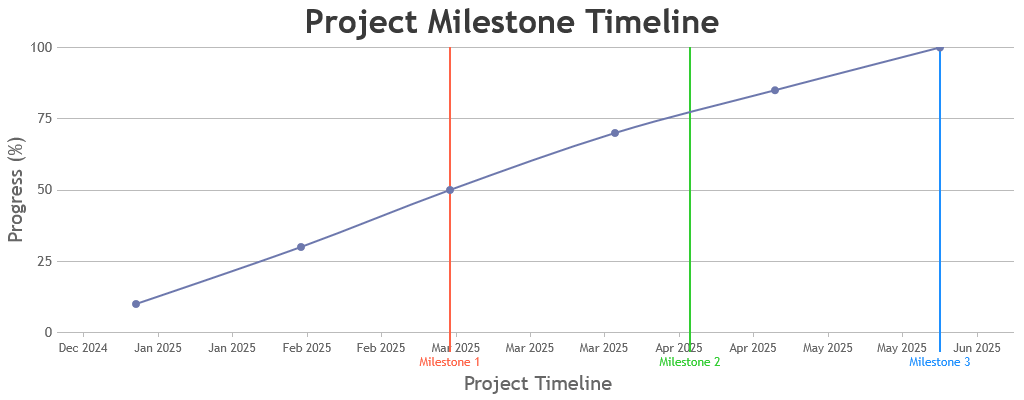
Today, we are releasing CanvasJS Chart v3.16.0 & StockChart v1.16.0 Beta 1, which include features related to stripline labels. Below is a summary of this release. Chart & StockChart Release Update Features & Improvements Added labelAngle property to striplines that allows you to adjust the angle of labels when they are placed
CanvasJS StockChart v1.15.24 GA Released
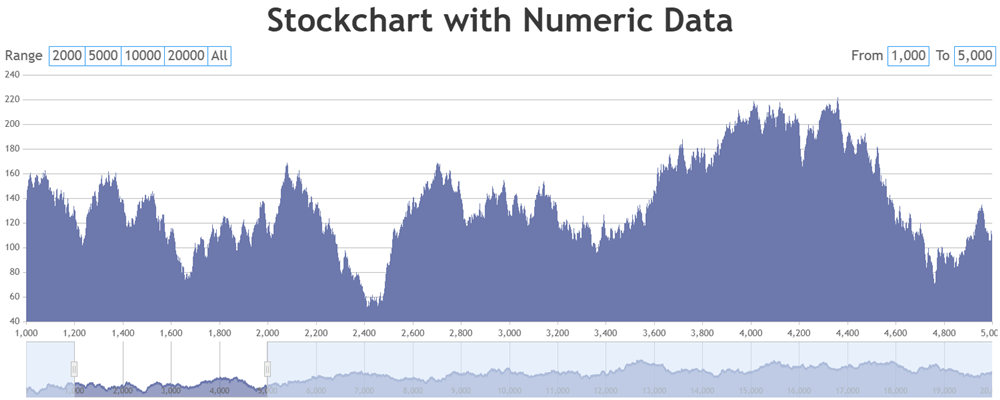
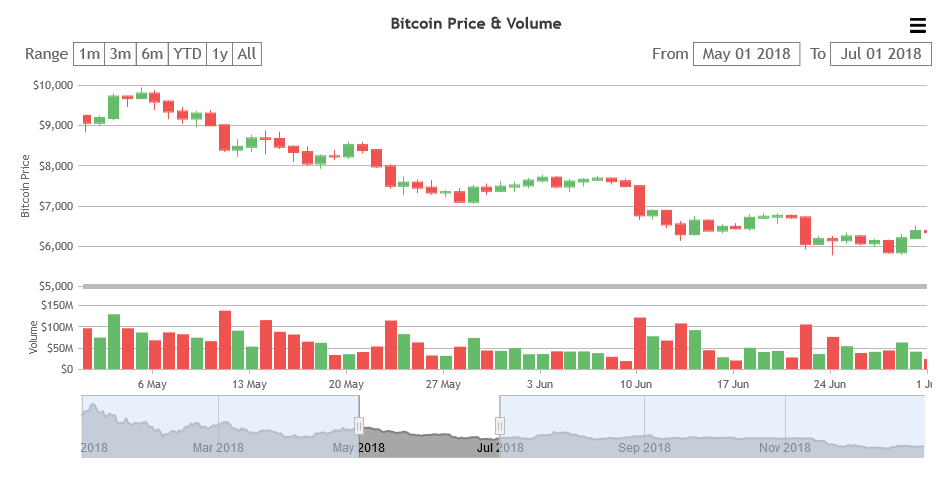
Today, we are releasing CanvasJS StockChart v1.15.24 GA, which includes a few improvements related to range buttons. Below is a summary of this release. StockChart Release Update Improvements & Enhancements Default range buttons are now generated dynamically based on the input data range. Previously, the number of buttons and their range /
CanvasJS Chart v3.15.23 & StockChart v1.15.23 GA Released
Today, we are releasing CanvasJS Chart v3.15.23 & StockChart v1.15.23 GA, which include a few bug fixes related to legends & StockChart. Below is a summary of this release. Chart Release Update Bug Fixes In some cases, the chart was throwing an error when axisXType or axisYType was set to undefined in
CanvasJS Chart v3.15.22 & StockChart v1.15.22 GA Released
Today, we are releasing CanvasJS Chart v3.15.22 & StockChart v1.15.22 GA, which include a few bug fixes related to tooltip showAtX method. Below is a summary of this release. Chart & StockChart Release Update Bug Fixes In some cases of Stacked & Stacked 100 charts, the position of tooltip was incorrect when
CanvasJS Chart v3.15.21 & StockChart v1.15.21 GA Released
Today, we are releasing CanvasJS Chart v3.15.21 & StockChart v1.15.21 GA, which include a few improvements related to grids in dual y-axis. Below is a summary of this release. Chart & StockChart Release Update Improvements & Enhancements Improved gridline rendering for charts with primary and secondary y-axes. axisY2 gridlines are now rendered