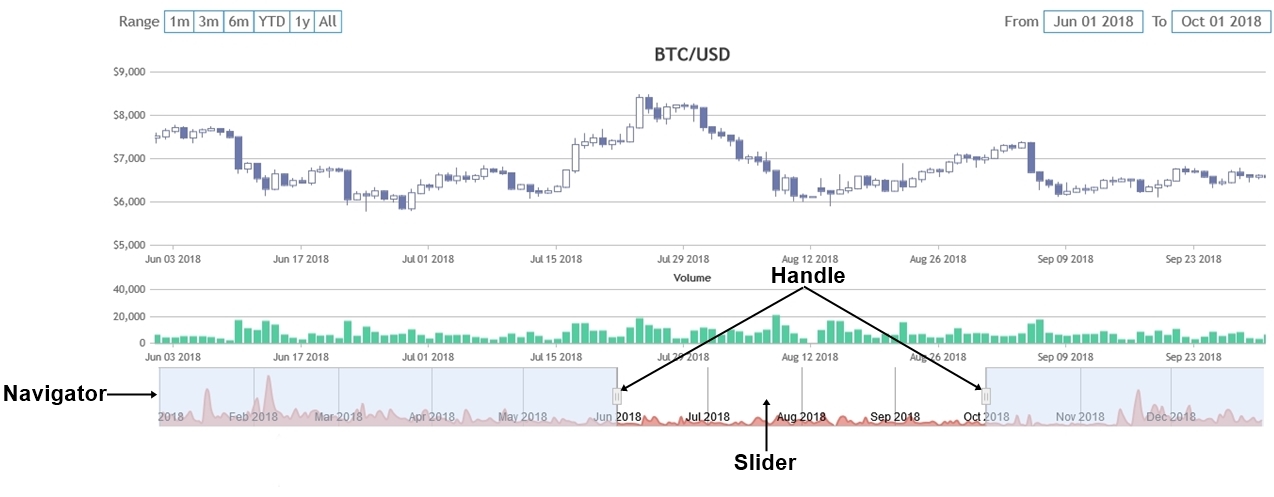
Overview – Navigator in StockChart
Navigator is used to show a preview of the entire range of data. It also allows you to select the range of values to be shown in the viewport of charts.
Syntax
var stockChart = new CanvasJS.StockChart("container",
{
 .
 .
navigator: {
  height: 100,
  .
  .
  slider: {
  .
  .
  },
  axisX: {
  .
  .
  }
  axisY: {
  .
  .
  },
  data: [{
  .
  .
  }]
  .
  .
 },
 .
 .
});
stockChart.render();
Navigator Attributes
Below are the properties which can be used to customize navigator.
| Applies To | Attribute | Type | Default | Options/Examples | Remarks |
|---|---|---|---|---|---|
| navigator | enabled | Boolean | true | false, true | |
| navigator | height | Number | Automatically Calculated based on the Stock Chart height | 300, 400, 500 … | |
| navigator | width | Number | Automatically Calculated based on the Stock Chart width | 500, 600, 800 … | |
| navigator | verticalAlign | String | “bottom” | “top”, “bottom” | |
| navigator | backgroundColor | String | null | “blue”, “#0000FF”, “rgb(0,0,255)” … | |
| navigator | animationEnabled | Boolean | false | false, true | |
| navigator | animationDuration | Number | 1200 | 500, 1000, 1500 … | |
| navigator | dynamicUpdate | Boolean | true | false, true |
Here is an example that shows how to enable animation in navigator.
slider Object
Slider is the element in Navigator which helps you select the range of values to be shown inside all Charts.
var stockChart = new CanvasJS.StockChart("container",
{
 .
 .
 navigator: {
   slider: {
     maskColor: "#a0beec"
     .
   }
   .
   .
 }
 .
 .
});
stockChart.render();
Slider Attributes
Below are the properties which can be used to customize the slider.
| Applies To | Attribute | Type | Default | Options/Examples |
|---|---|---|---|---|
| slider | maskColor | String | “#d9e8f9” | “rgb(100,149,237)”, “#beebe9” |
| slider | maskOpacity | Number | 0.6 | 0.4, 0.5 … |
| slider | maskInverted | Boolean | false | true, false |
| slider | handleColor | String | “#EFEFEF” | “rgb(105,105,105)”, “#271b1b” |
| slider | handleBorderColor | String | “#3A3A3A” | “red”, “yellow” ,”#FF0000″ |
| slider | handleBorderThickness | Number | 1 | 1, 2, 3 … |
| slider | handleWidth | Number | Automatically Calculated based on the navigator width | 10, 20 … |
| slider | handleHeight | Number | Automatically Calculated based on the navigator height | 30, 40 … |
| slider | minimum | Number / Date / Timestamp | Automatically Calculated based on the data | new Date(2018, 03, 12), 120 … |
| slider | maximum | Number / Date / Timestamp | Automatically Calculated based on the data | new Date(2019, 02,03), 250 … |
| slider | outlineColor | String | “#666666” | #dedede”, “black” |
| slider | outlineThickness | Number | 1 | 1, 2 … |
| slider | outlineInverted | Boolean | false | true, false |
Setting initial Range of Slider
You can set the initial range of slider (and all charts as a result) while rendering StockChart for the first time. You can do so by setting minimum and maximum properties of the slider. Below is an example
Inverting Masked Region
You can invert the masked region of navigator by setting the maskInverted property to true.