toolbar: object
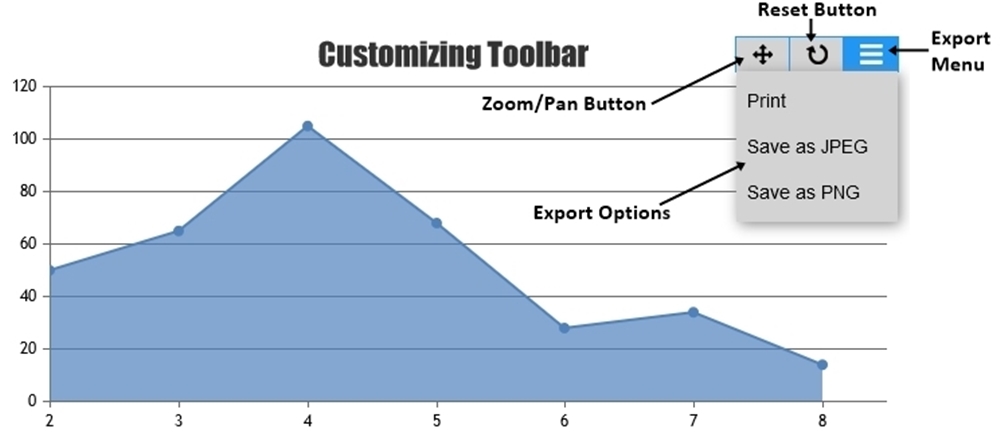
Chart Toolbar contains various tools and options like Zoom, Pan, Reset, Print, Save as Image, etc. toolbar Object lets you customize the look & feel of various options available.
var chart = new CanvasJS.Chart("container",
{
 .
 .
 toolbar: {
     itemBackgroundColor: "#fff",
     itemBackgroundColorOnHover: "#eccaa0",
     buttonBorderColor: "#eccaa0",
     buttonBorderThickness: 2,
     fontColor: "#d6d6d6",
     fontColorOnHover: "#d3d3d3"
 },
 .
 .
});
chart.render();
Toolbar Attributes
| Applies To | Attribute | Type | Default | Options/Examples |
|---|---|---|---|---|
| toolbar | itemBackgroundColor | String | “white” | “blue”, “#d3d3d3”,… |
| toolbar | itemBackgroundColorOnHover | String | “#2196f3” | “red”, “#3e3e3e”,… |
| toolbar | buttonBorderColor | String | “#2196f3” | “red”, “#3e3e3e”,… |
| toolbar | buttonBorderThickness | Number | 1 | 2, 3,… |
| toolbar | fontColor | String | “black” | “yellow”, “#000”,… |
| toolbar | fontColorOnHover | String | “white” | “white”, “#e3e3e3”,… |
Try Editing The Code
Also See: