Overview – Displaying & Customizing Chart Title
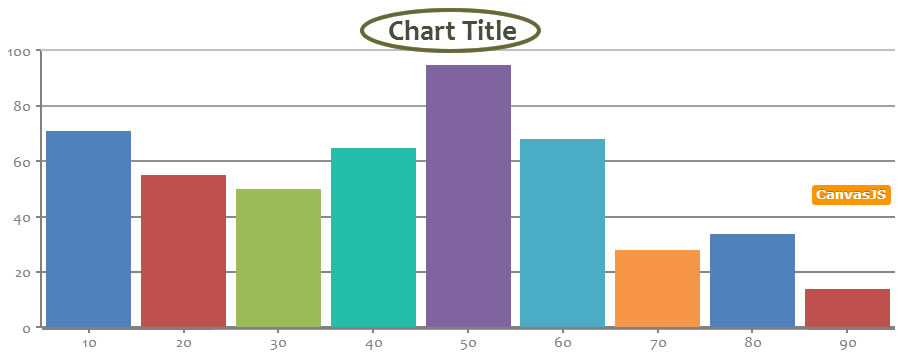
A Chart Title usually appears above the main Plot Area and provides a succinct description of the chart. Title object provides attributes which help in setting content, appearance and position of the chart title.
Syntax
A Charts Title is used to describe the chart.
var  chart =  new  CanvasJS.Chart("container",
{
 .
 .
 title:{
     text: "Chart Title"
    // more attributes
 },
 .
 .
});
chart.render();
Creating a Basic Title
The most important title attribute is text. Any text can be added to the Chart’s Title using this attribute.
In the following example we have a title object with a simple text attribute.
Styling Our Title
There are number of attributes we can set inside title object and Style it the way we want to. Table below lists some of the styling attributes.
| Attribute | Type | Default | Options/Examples |
|---|---|---|---|
| backgroundColor | string | null | “red”, “yellow” , “#FF0000” .. |
| borderColor | string | “black” | “red”, “yellow” ,”#FF0000″ .. |
| borderThickness | number | 0 | 2,6 .. |
| cornerRadius | Number | 0 | 5,8, .. |
| fontColor | string | “black” | “red”, “yellow” ,”#FF0000″ .. |
| fontFamily | string | “calibri” | “arial” , “tahoma”, “verdana” .. |
| fontSize | number | 20 | 25, 30 .. |
| fontStyle | string | ““normal”” | “normal”,“italic”, “oblique” |
| fontWeight | string | “normal” | “lighter”, “normal, “bold”, “bolder” |
| margin | number | 5 | 10, 12 .. |
| padding | number | 0 | 5, 8 .. |
| textAlign | String | Depends on horizontalAlign | “left”, “center”, “right” |
| wrap | Boolean | true | true, false |
| maxWidth | Number | Automatically calculated based on the chart size. | 200, 400 etc. |
| dockInsidePlotArea | Boolean | false | true, false |
Title Alignment
Title can be positioned in 9 different places by combining verticalAlign and horizontalAlign properties. Below is a table showing various combinations.
| Options | horizontalAlign | verticalAlign |
|---|---|---|
| 1 | left | top |
| 2 | left | center |
| 3 | left | bottom |
| 4 | center | top |
| 5 | center | center |
| 6 | center | bottom |
| 7 | right | top |
| 8 | right | center |
| 9 | right | bottom |
You can try out all the combinations below.
Finishing it up
Combining all the Title attributes can yield a beautiful title. Put on your artistic caps and come up with your own styles.
Also See:
12 Comments
Could you think of any way to display a subtitle under the title?
With a different font-size, of course.
Thanks!
Can be use Title with Variable
for example, i have some value that POST from another php page
Is that can ne
title =
title = —php command here—-
Yes. You can just echo the required values in PHP.
Can you please provide a simple example of how to echo a php variable for a chart title? It shows the php code as a literal string. CanvasJS is awesome and everyday I learn some new trick that makes it better and better!
Here is an example for your query.
var chart = new CanvasJS.Chart(“chartContainer”, {
title:{
//text: “Basic Column Chart – CanvasJS”
text: “”
},
data: [
{
type: “column”,
dataPoints: [
{ label: “apple”, y: 10 },
{ label: “orange”, y: 15 },
{ label: “banana”, y: 25 },
{ label: “mango”, y: 30 },
{ label: “grape”, y: 28 }
]
}
]
});
chart.render();
how can i set the transperent colors or make cahnges in opacity of graph when overlapped??
maulik,
Please use fillOpacity property for the same.
How can I change the title at run time, for example: chart.title.text = “Loading….”; I am getting an error message that the title is undefined.
hassan,
You should be updating title via the options object that was initially passed to the constructor. Please try chart.options.title.text = “Loading…” and call chart.render() after that.
Is there a way to format only a portion of the title (e.g. subscript and superscript)
Sorry Jason, formatting a portion of axis title is not available as of now.
We accept uni-code character in a string. So, using
\u00B2(uni-code of superscript 2) you will be able to show 2 as superscript in title.