CanvasJS v1.5.6 Released
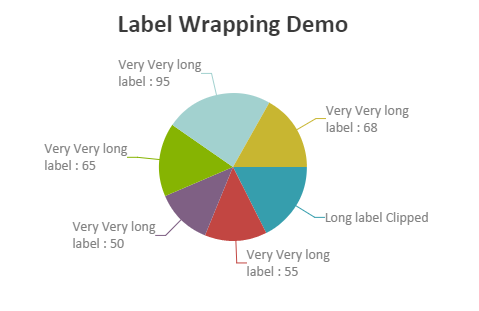
Today we are releasing 1.5.6 GA with several bug fixes. Below is a summary of this release. Bug Fixes indexLabelWrap was not working at the dataPoint level Labels at axis maximum were not being show in few cases due to JavaScript number precision problems Click event was firing after zooming Updating exportEnabled & exportFileName dynamically
CanvasJS v1.5.5 includes jQuery Charting Plugin
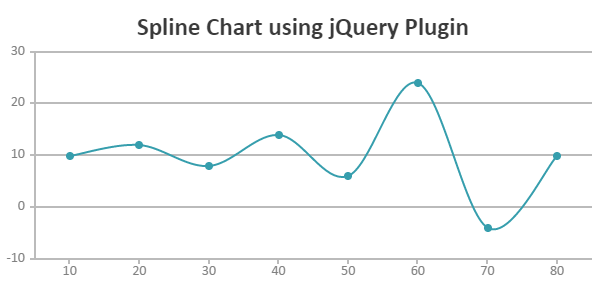
Since the first version of CanvasJS our primary goal has been to make it as simple as possible for you to create and add charts. Given that jQuery is being used widely over the web, we thought of building a simple jQuery plugin that would allow you to integrate CanvasJS Charts the jQuery way! So
CanvasJS Charts 1.5 goes GA
We are releasing v1.5 with several bug fixes and enhancements. Overall v1.5 comes with some of the most requested features like Export features and financial charts. Below is the summary of improvements and bug fixes that we have done from v1.5 beta to v1.5 GA. You can read more about the features introduced in v1.5
CanvasJS v1.5 comes with Stock Charts, Range Charts & Export as Image Feature
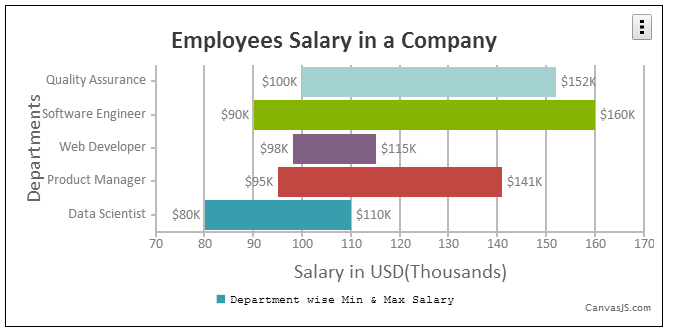
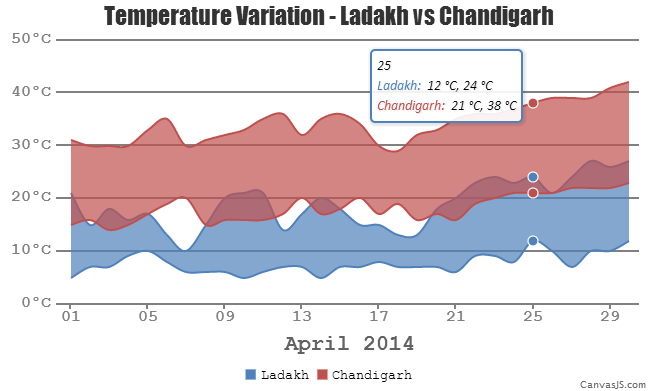
Today we are releasing v1.5 (beta) of CanvasJS with some major features that you have been waiting for. In this version we have implemented 6 new Chart Types – Candlestick, OHLC, Range Column, Range Bar, Range Area & Range Spline Area – which takes the total chart types supported to 24. We have also implemented
CanvasJS v1.4 goes GA
Today version 1.4 is coming out of beta with several bug fixes and enhancements. Below is a summary of this release. Bug Fixes: Fixed an issue in Area & StepArea where it used to throw exception where there are no dataPoint inside plotArea – mainly effected while zooming into null area In Pie / Doughnut
CanvasJS Chart Version 1.4 Beta with StripLines, Legend Events & Support for Empty Data Points
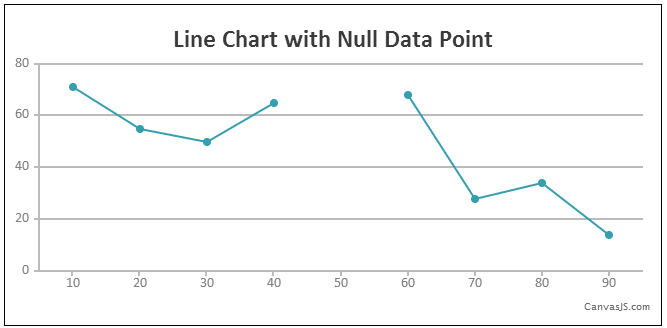
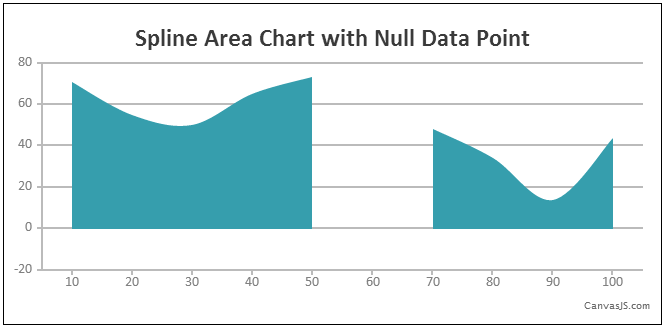
Here is version 1.4 Beta with most sought after features like StripLines (TrendLines), Event for Legend Items & support for Empty/Null Data Points in Chart. Below is a summary of this release New Features & Improvements Support for StripLines / TrendLines Events for Legend Items – itemclick, itemmouseover, itemmouseout & itemmousemove Support for Empty /
CanvasJS Charts v1.3 goes GA
Today CanvasJS Charts v1.3 is going GA with some major improvements to pie labelling. We have also added one new chart type (stepArea) which takes the total number of supported chart types to 18. Now CanvasJS also supports deferred setting of chart options which is explained in the section “alternate way of setting / updating
CanvasJS v1.3 is Retina Ready and Supports IE6+
Here is version 1.3 with some major improvements! Ever since the first release, IE8- support has been a popular request among our users along with retina display support. Today we are releasing version 1.3 that implements both. This version also comes with some major improvement in the way tooltip works. Earlier in case
Version 1.2 Supports Localization of Charts
From version 1.2 onwards you’ll be able to localize your charts based on the language, number formatting style, etc. One important feature is that you can now specify the decimalSeparator & digitGroupSeparator (also called as thousand separator). Below is the summary of this release with relevant links. New Features: Chart Localization Support Added Cursor Property
Version 1.1 Beta adds 3 new Charts Types – Spline, Step Line and Spline Area
When we first released CanvasJS, it supported 14 different types of Charts that are most commonly used. But we are committed to support all the important chart types that you need to visualize data. As such, today we are releasing version 1.1 beta that add 3 new types of charts – Spline, Spline Area &
