Today version 1.4 is coming out of beta with several bug fixes and enhancements. Below is a summary of this release.
Bug Fixes:
- Fixed an issue in Area & StepArea where it used to throw exception where there are no dataPoint inside plotArea – mainly effected while zooming into null area
- In Pie / Doughnut Charts Labels were getting skipped unnecessarily in few cases
- Columns were not fitting inside the chart when there were more than 8-10 series each with single data point
- When all z values were equal in case of Bubble chart, they were getting rendered as tiny dots instead of having some default size.
- Decimal Separator was getting added when a string literal is added after decimal even if there is no number after the decimal point.
- When using touch based devices, it was not possible to scroll down the webpage by dragging over the chart because chart used to swallow the events.
- If render method was called again before the animation is over, existing animation was not stopping.
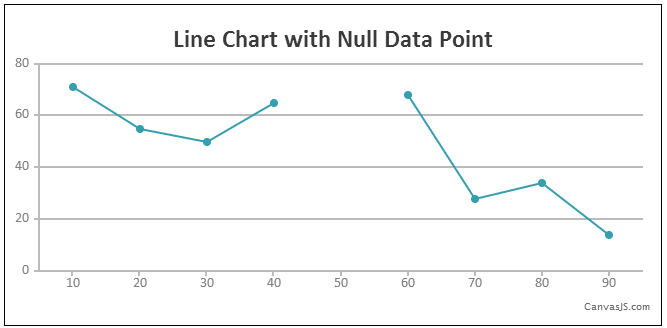
- If first data Point was empty, then it would create a box around the plot area in case of line type of charts
- Fixed and issue because of which includeZero (false) was not working when there are empty dataPoints
Enhancements & Behavioral Changes:
- Implemented interactivityEnabled property under chart which disabled all chart interactivity including mouse and touch.
- Calling render method readjusts the width and height of the chart if its container’s size has changed.
- Now all chart properties can be updated dynamically.
- White Borders around Pie/Doughnut slices have been removed
For more information please refer to the 1.4 Beta Release blog.
Leave a Reply