CanvasJS Chart v1.9.0 Beta with Logarithmic Axis
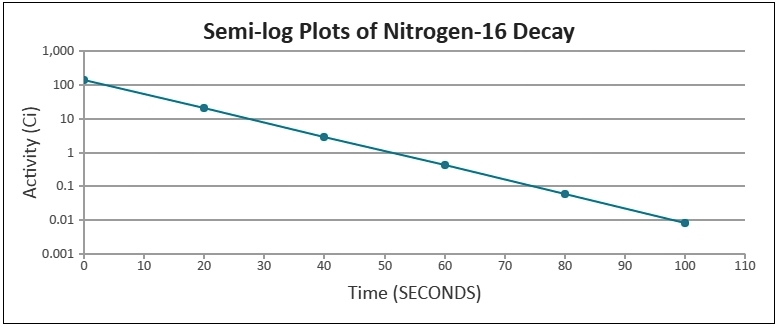
Today we are releasing 1.9.0 Beta 1 with Logarithmic Axis (supported in both X & Y Axis) which was one of the most requested features. This allows you to visualize data which changes by multiple orders in magnitude. You can also combine Linear and Logarithmic Scales to create Simi-Log Plots. Below is an example &
CanvasJS Chart 1.8.5 goes GA
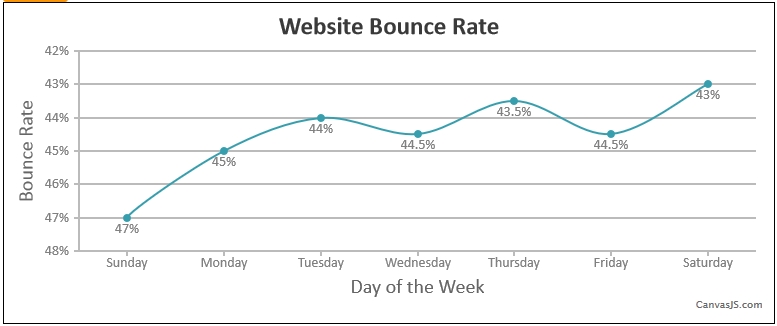
Today we are releasing 1.8.5 GA. Below is a summary of the release. Highlights of Version 1.8.5 Below are some of the new features that come as part of v1.8.5 reversed property for Axis has been implemented which reverses corresponding axis and will plot accordingly from the opposite side. Auto-labeling has been improved to handle
CanvasJS Charts v1.8.5 Beta-2 Released
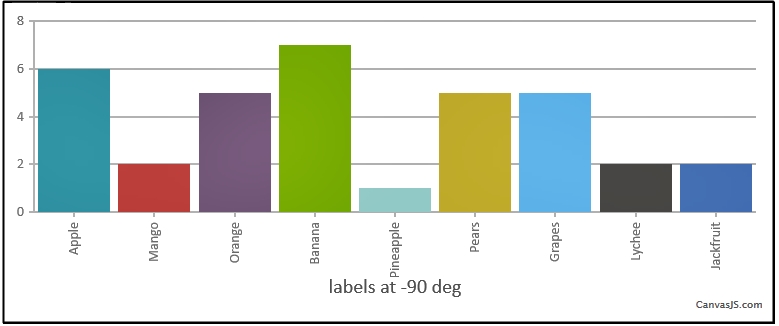
Today we are releasing 1.8.5 Beta 2 with auto-labelling enhancement and several bug fixes. Below is a summary of the release. New Features & Enhancement Auto-Labelling has been improved. Bug Fixes Axis-labels were rotating for smaller label length in few cases. Ticks were not rendering for dateTime axis. labelAngle set to -90 was resulting in


