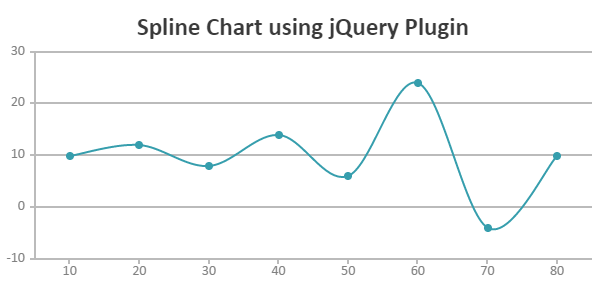
Since the first version of CanvasJS our primary goal has been to make it as simple as possible for you to create and add charts. Given that jQuery is being used widely over the web, we thought of building a simple jQuery plugin that would allow you to integrate CanvasJS Charts the jQuery way! So if you find $(“selector”).someAction() way of adding chart convenient, you can do so with CanvasJS Charting Plugin for jQuery.
Please note that this is an optional plugin included along with the download and is in no way intended to replace the standalone version. You can check out some of the examples that we have created using jQuery Charts Plugin. Please refer to our documentation on jQuery Plugin for more information.
Release Summary:
New Features & Enhancements
- Optional jQuery Plugin included
- Implemented new option “auto” for indexLabelPlacement
- percentFormatString in dataSeries
New Properties & Keywords
- percentFormatString in dataSeries
Please download the latest version from our download page and let us know your feedback. Please report any bugs in the forum.
Thank You,
Sunil Urs
Team CanvasJS

Leave a Reply