CanvasJS v1.9.5.1 released
Today we are releasing 1.9.5.1 GA with a few bug fixes. Below is a summary of the release. Bug Fixes axisY range was not updated properly when zooming along axisX. When multiple axisX were used with different value-types (numeric & dataTime), valueFormatString was not accepted properly. Issue in rendering chart with empty dataPoints array
Feature Roundup – All Major Updates in CanvasJS Charts
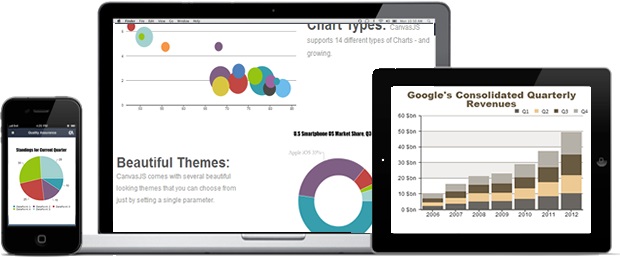
Last one year has been very good for us in terms of number of users/companies adopting our charts including several Fortune 100 Companies. We were also featured on ProductHunt. Many of our customers are impressed with the performance and ease of using CanvasJS Charts – this is what we have been striving for since the
CanvasJS v1.9.5 goes GA
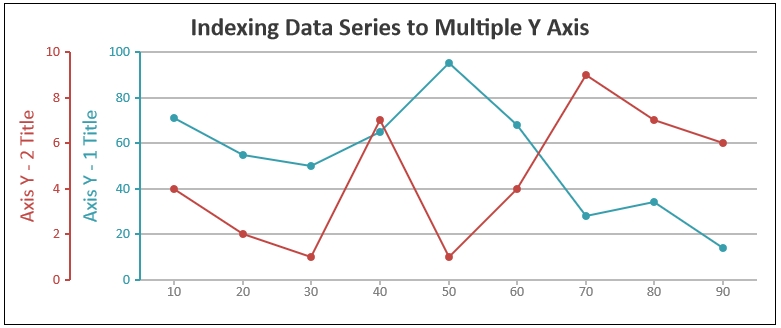
Today we are releasing 1.9.5 GA. Below is a summary of this release. New Features labelBackgroundColor has been added to set background color to axis labels. Highlight of Version 1.9.5 Secondary X Axis which renders on the opposite side of Primary X Axis (axisX). Support for Multiple X axis which allow you to
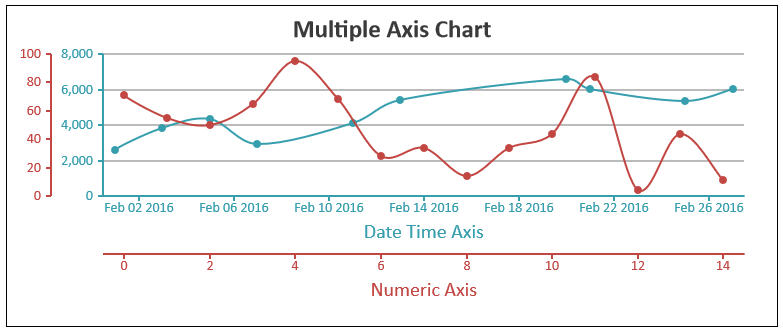
CanvasJS v1.9.5 with Multiple X / Y Axis Support

Today we are releasing 1.9.5 Beta 1 with the most requested feature, multiple axes and a few bug fixes. Below is a summary of this release. New Features & Enhancement Secondary X Axis which renders on the opposite side of Primary X Axis (axisX). Multiple Y axis which allows you to render Multiple
CanvasJS Chart 1.9.2 GA Release
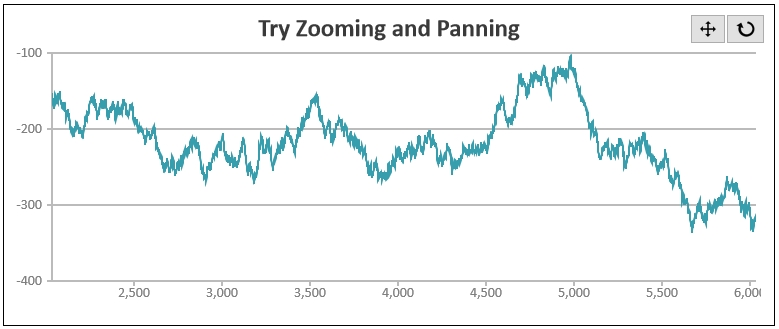
Today we are releasing 1.9.2 GA with some performance enhancements and bug fixes. Below is a summary of the release. Highlights of Version 1.9.2 Improved Zooming / Panning performance in Firefox and Internet Explorer. Bug Fix Pie/Doughnut charts were throwing error in a few cases where x-values were present and being used in
CanvasJS Chart 1.9.1 GA Release
Today we are releasing 1.9.1 GA with a bug fix in the axis. Below is a summary of the release. Bug Fix In mobile devices, labels were not rendered in certain cases when labelAngle was set. In coming weeks we’ll be adding support for multiple axes which has been one of the most requested
CanvasJS Chart 1.9.0 goes GA
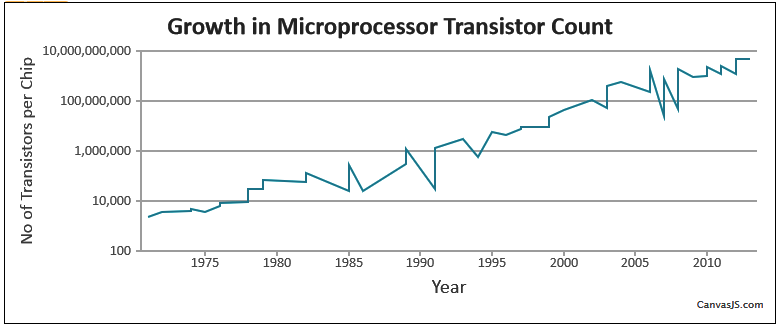
Today we are releasing 1.9.0 GA with one of the most requested features, Logarithmic Axis. Highlights of Version 1.9.0 Logarithmic Scale implemented for both X & Y Axis. In coming months we’ll be improving chart axis with more power packed features. So do check out these features and let us know your feedback.
CanvasJS Chart v1.9.0 Beta with Logarithmic Axis
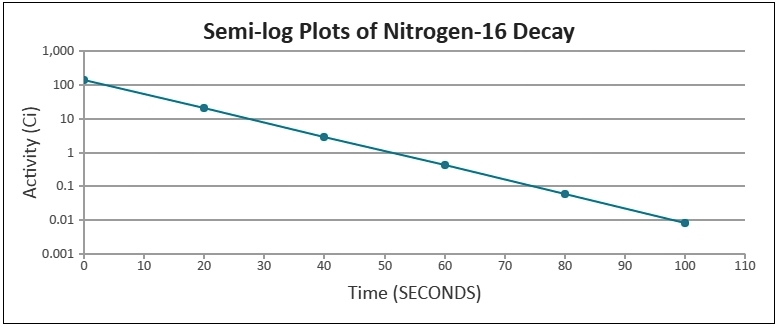
Today we are releasing 1.9.0 Beta 1 with Logarithmic Axis (supported in both X & Y Axis) which was one of the most requested features. This allows you to visualize data which changes by multiple orders in magnitude. You can also combine Linear and Logarithmic Scales to create Simi-Log Plots. Below is an example &
CanvasJS Chart 1.8.5 goes GA
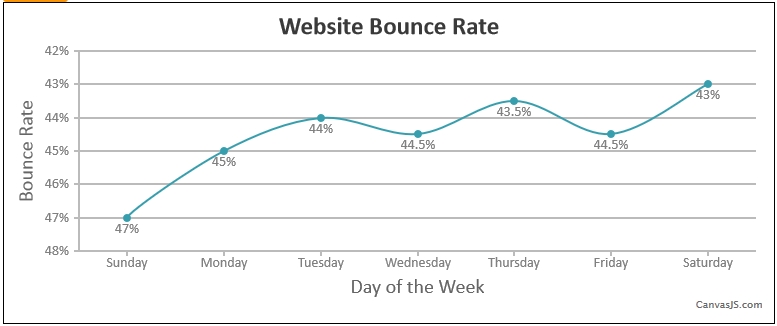
Today we are releasing 1.8.5 GA. Below is a summary of the release. Highlights of Version 1.8.5 Below are some of the new features that come as part of v1.8.5 reversed property for Axis has been implemented which reverses corresponding axis and will plot accordingly from the opposite side. Auto-labeling has been improved to handle
CanvasJS Charts v1.8.5 Beta-2 Released
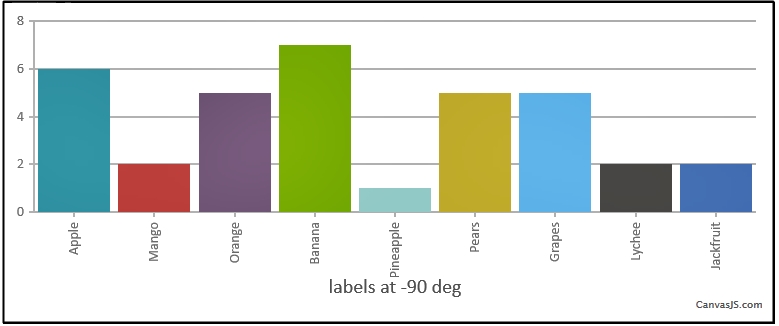
Today we are releasing 1.8.5 Beta 2 with auto-labelling enhancement and several bug fixes. Below is a summary of the release. New Features & Enhancement Auto-Labelling has been improved. Bug Fixes Axis-labels were rotating for smaller label length in few cases. Ticks were not rendering for dateTime axis. labelAngle set to -90 was resulting in