CanvasJS v1.9.8 GA Released
Today we are releasing 1.9.8 GA with a few bug fixes. Below is a summary of the release. Bug Fix: CanvasJS.formatNumber method was not accurate in few cases of exponential formatString. Animation was not happening properly in case of Bar Chart along Secondary X-Axis. stackedArea Chart was throwing error when non-aligned x-values were present.
CanvasJS Chart v1.9.0 Beta with Logarithmic Axis
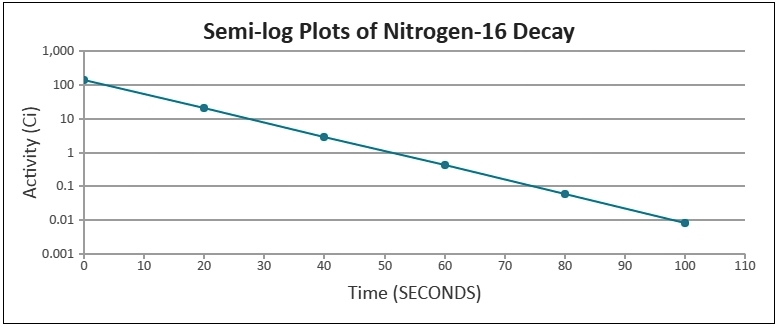
Today we are releasing 1.9.0 Beta 1 with Logarithmic Axis (supported in both X & Y Axis) which was one of the most requested features. This allows you to visualize data which changes by multiple orders in magnitude. You can also combine Linear and Logarithmic Scales to create Simi-Log Plots. Below is an example &
CanvasJS Chart 1.8.1 goes GA
Today we are releasing 1.8.1 GA with a few bug fixes. Below is a summary of this release. Highlights of Version 1.8.1 Below are some of the new features that come as part of v1.8.1 Auto-Labelling which automatically handles label placement in the best possible way. connetNullData which allows you to show discontinuity of dataPoints