CanvasJS v2.1.3GA Released
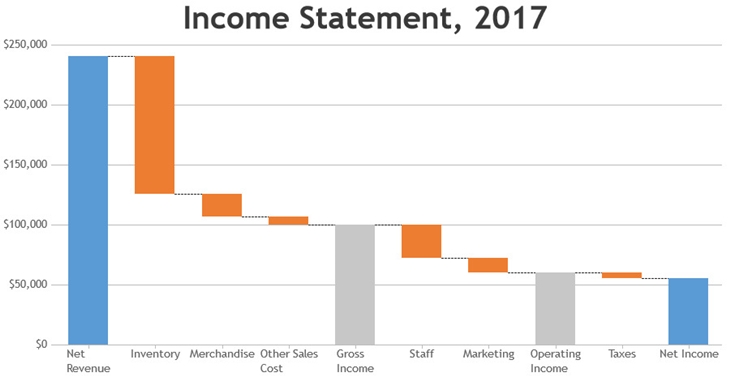
Today we are releasing 2.1.3 GA with a few bug fixes and enhancements. Below is a summary of this release. Bug Fixes: In few cases of waterfall chart when y-values of the falling dataPoint was between -1 and 0, the connecting line between the falling dataPoint and its previous dataPoint was not drawn
CanvasJS v2.1.2GA Released
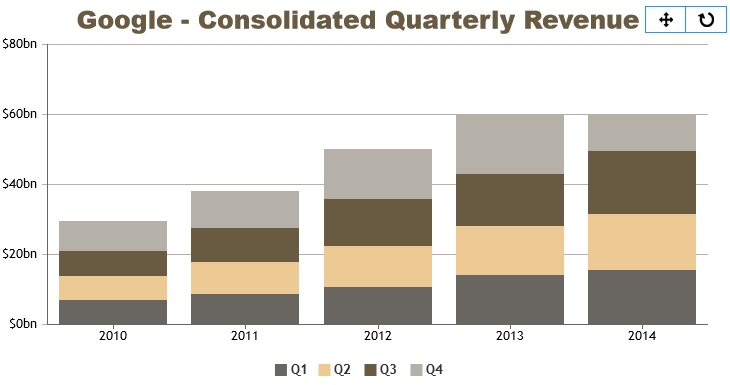
Today we are releasing 2.1.2 GA with a bug fix. Below is a summary of the release. Bug Fixes: Whenever viewportMaximum was set programmatically and then panned, dataPoints in Stacked Charts outside the set viewportMaximum were not being rendered. We thank Bimal Shah for reporting this issue. Do download the latest
CanvasJS v2.1.1GA Released
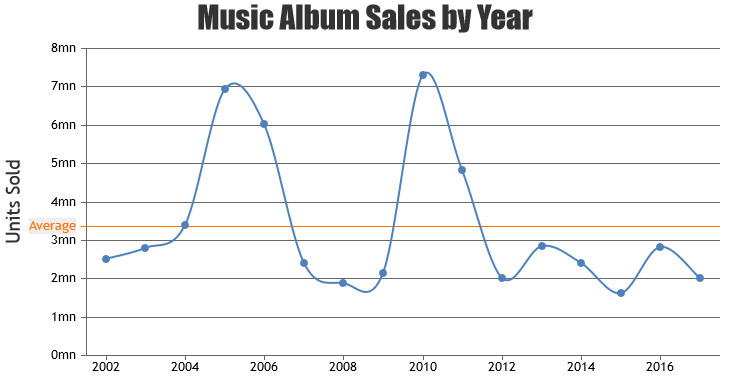
Today we are releasing 2.1.1 GA with a few bug fixes. Below is a summary of the release. Bug Fixes: In few cases, a part of stripline label was rendering inside the plotArea even when labelPosition was set to outside. In few cases, stripline label was getting clipped when labelPosition was set to
CanvasJS v2.1GA Released
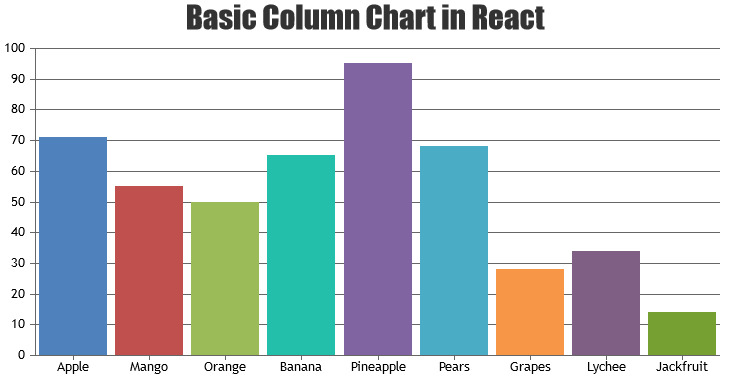
Today we are releasing 2.1 GA with the most awaited feature, importing CanvasJS as a module to any of the front-end frameworks. You can easily import CanvasJS while working with any front-end frameworks like React, Angular, Vuejs, etc. You can checkout the examples in our angular and react gallery pages. Do download the
CanvasJS v2.0.2GA Released
Today we are releasing 2.0.2 GA with a few bug fixes. Below is a summary of the release. Bug Fixes: In few cases of stackedColumn100 / stackedBar100 charts, there was a small gap towards the extreme end of last dataPoint. In few cases, skipped axis labels were still being rendered to the top-left
CanvasJS v2.0.1GA Released
Today we are releasing 2.0.1 GA with a few bug fixes. Below is a summary of the release. Bug Fixes: Click event was firing twice in mobile devices. In few cases of Bar Chart, striplines were not getting rendered. In candlestick, ohlc, box & whisker and range charts, Y axis range was not
New Spring MVC Samples added to the Demo Gallery
Today, we are very excited to announce that we have added Spring MVC Samples to demo gallery. This release is one of the series of chart gallery releases over the past weeks including ASP.Net MVC, PHP, JSP galleries. Spring MVC Gallery showcases a large number of chart examples from simple Line, Column, Pie to Financial
New JSP, ASP.Net, PHP and jQuery Samples added to the Demo Gallery
Today, we are very excited to announce that we have added JSP Samples to demo gallery. This release is one of the series of chart gallery releases that we have done over the past weeks and will be continuing. A new chart gallery for Spring MVC is also planned for release very soon. JSP Gallery
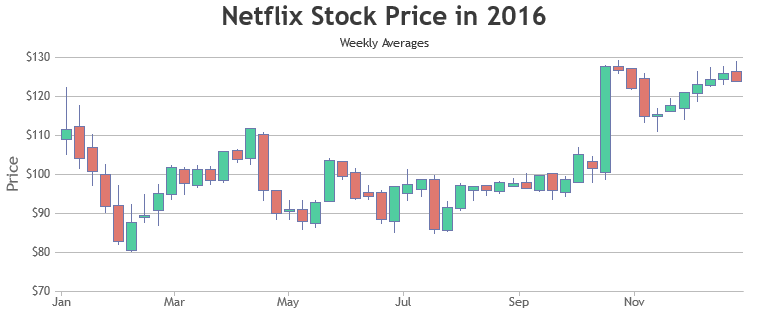
CanvasJS v2.0 with 5 New Chart Types, Axis Scale-Breaks and Crosshair goes GA
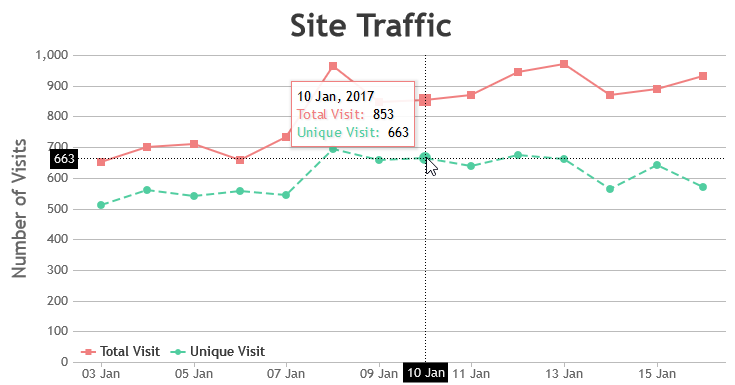
In recent releases, we kept our promise by implementing most requested features like multiple axes, reversed and logarithmic axis, methods and properties, etc. Now we are proud to release version 2.0 of CanvasJS Charts with 5 new chart types making it a grand total of 30 charts. v2.0 also includes crosshair and axis scale-breaks, popular
CanvasJS v2.0 Beta-2 Released
Today we are releasing v2.0 Beta 2 with some new features, improvements and bug fixes. Below is a summary of this release. New Features & Enhancements Apart from number, padding in title now supports object as well. This object can have separate top, bottom, left and right paddings. fallingColor is introduced in candlestick chart.