In recent releases, we kept our promise by implementing most requested features like multiple axes, reversed and logarithmic axis, methods and properties, etc. Now we are proud to release version 2.0 of CanvasJS Charts with 5 new chart types making it a grand total of 30 charts. v2.0 also includes crosshair and axis scale-breaks, popular requests in last couple of months, along with new and improved themes & colorsets that makes the chart look more beautiful.
New Chart Types
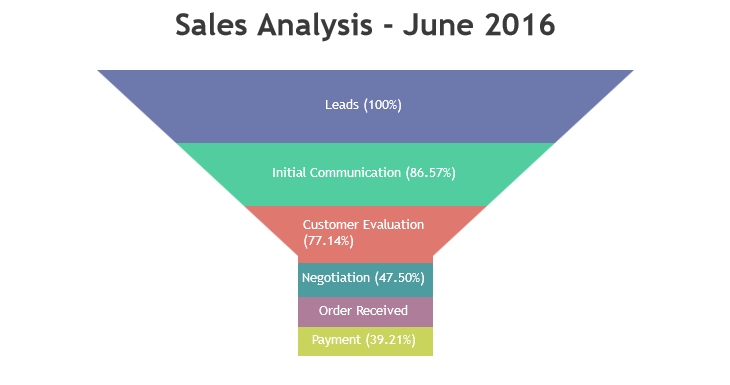
- Funnel Chart – widely used in visualizing sales process.
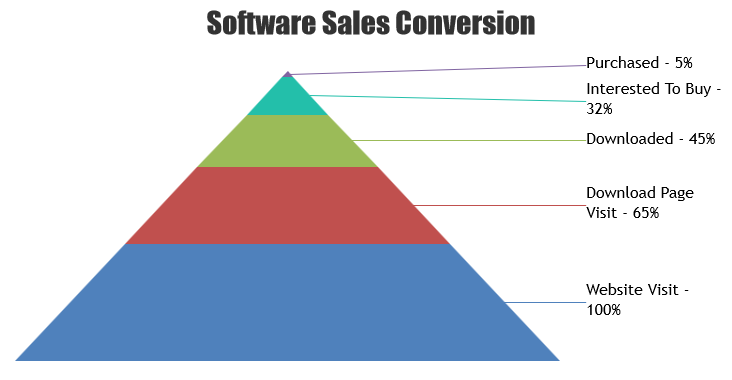
- Pyramid Chart – used to show data that are hierarchical in nature, indicating a progressive order.
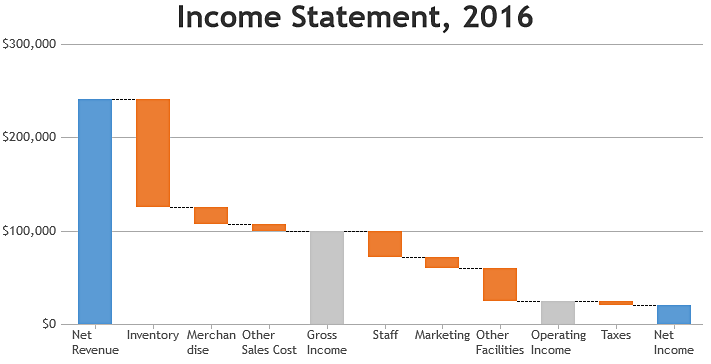
- Waterfall Chart – useful for understanding the cumulative effect of positive and negative changes to an initial value and are mostly used as Financial Charts.
- Box & Whisker Chart – used to show the distribution of numerical data through their quartiles, highlighting the median / mean values.

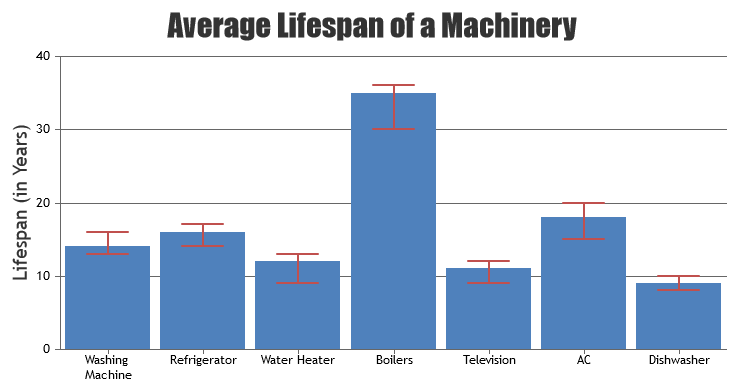
- Error Chart – used to show uncertainty or variability of data used on graphs.
New Features
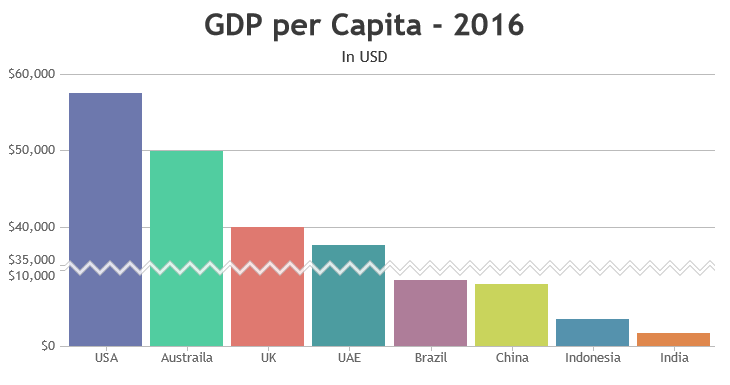
- scaleBreaks – used to display two distinct ranges in the same chart area.
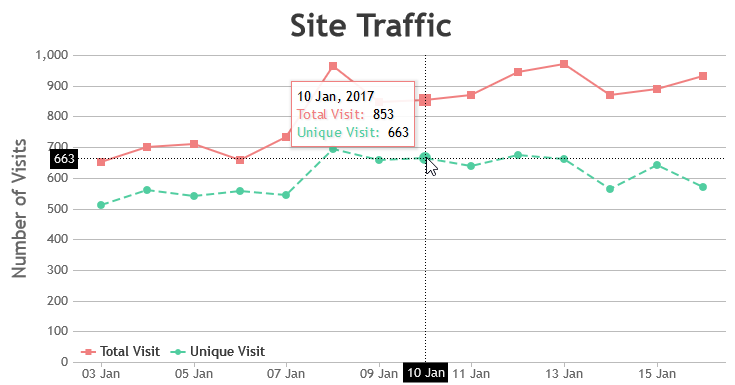
- Crosshair – horizontal and / or vertical lines that moves along with mouse cursor and are also an alternative to tooltip.
New Properties & Enhancements
- New improved Themes that makes chart look much better.
- fallingColor is introduced in candlestick chart, that helps to distinguish fall in value by its color easily.
- reversed property has been introduced in data-series level that inverts the orientation of Funnel and Pyramid Charts.
- Improved zoom/pan, reset and export buttons.
- Apart from number, padding in title now supports object. This object can have separate top, bottom, left and right paddings.
Bug Fix:
- In few cases, axisY2 labels were overlapping plotArea.
- set method was not working for axisY in case of bar chart.
- Setting itemMaxWidth or itemWidth in Legend was breaking same word at different characters.
- When chart was exported as image in Safari, it was opening in new tab instead of downloading.
- In IE8, exploded property was not working properly in case of Funnel / Pyramid chart.
Thank you for trusting us and for all the valuable feedbacks that you have given. This has helped us in improving the product and make it better day by day.
Do download the latest version from our download page and let us know your feedback.
Thank You,
Vishwas R
Team CanvasJS
6 Comments
Nice work. Representations are easy to understand and visually appealing
Any of your customers using it with React. What is your recommended approach with integrating CanvasJS with React
Nice additions.
KUDOS team CanvasJS.
Very nice library. Only a shame it went from 259 Kb in version 1 to 443 Kb in version 2.
hi team….
i have created scatter chart and decided it into 9 section . now i want to color each section with different color. please help me on
vikas.3rdeyeadvisory@gmail.com
Vikas,
Can you kindly post your query in forum along with jsfiddle that reproduces the issue you are facing?