Today we are releasing v2.0 Beta 1 with 5 new chart types, several new features, improved themes and few bug fixes. Below is a summary of this release.
New Features & Enhancement
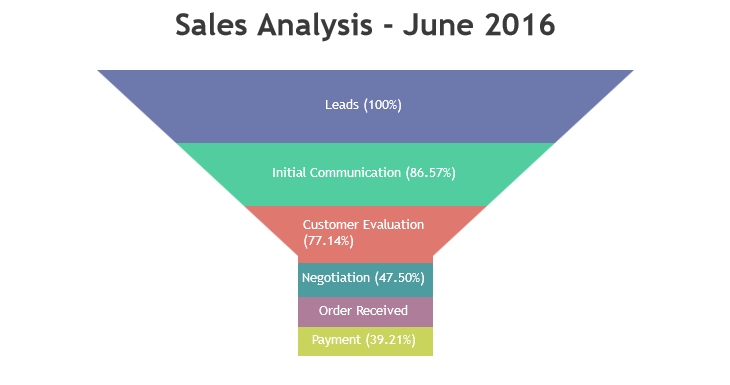
- Added 5 new chart-types, viz. Funnel, Pyramid, Error, Waterfall and Box & Whisker.
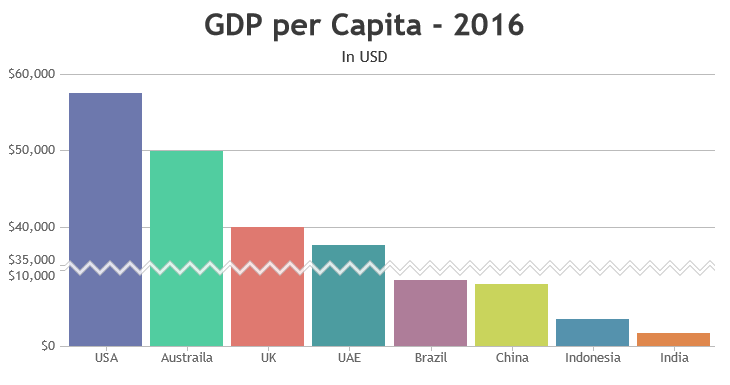
- Axis Scale-Breaks has been added to change/shrink the axis scale.
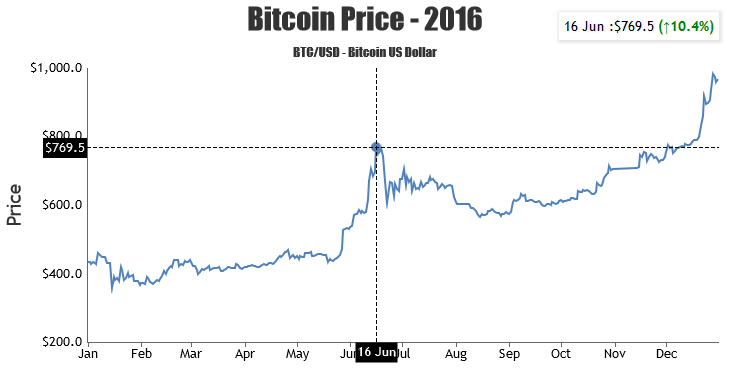
- Crosshair, a movable vertical or horizontal line, has been added.
- New themes and colorsets have been added.
New Properties & Keywords
- scaleBreaks has been introduced to change / shrink the axis scale, which can be custom or auto-calculated.
- crosshair has been introduced in axis.
- reversed property has been introduced in data-series level that inverts the orientation of Funnel and Pyramid Charts.
Bug Fixes
- labelFontWeight and labelFontStyle were not proper in Stripline.
- In Stacked Charts, calculation of total was not proper when negative dataPoints were used.
- In few cases, labels were not appearing towards maximum of the axis.
- Chart was throwing error, when compiled in strict mode.
Do download the latest version from our download page and let us know your feedback.
Note:
We have improved existing themes and started using new naming conventions for them. Earlier theme names will still work but will be deprecated in future versions. Please check themes page for more info.
Thank You,
Vishwas R
Team CanvasJS
Comment
Would still like the feature to control the size of the bar in terms of the width so I could use bar graphs to put them in a sort of ‘time line’ such as ‘this bar represents how long this lasts’ and then have other bars that could be at the same time, but they’d be represented as different based on the y-axis.
If that makes sense.
But these changes are looking good so far.