Today we are releasing v2.0 Beta 2 with some new features, improvements and bug fixes. Below is a summary of this release.
New Features & Enhancements
- Apart from number, padding in title now supports object as well. This object can have separate top, bottom, left and right paddings.
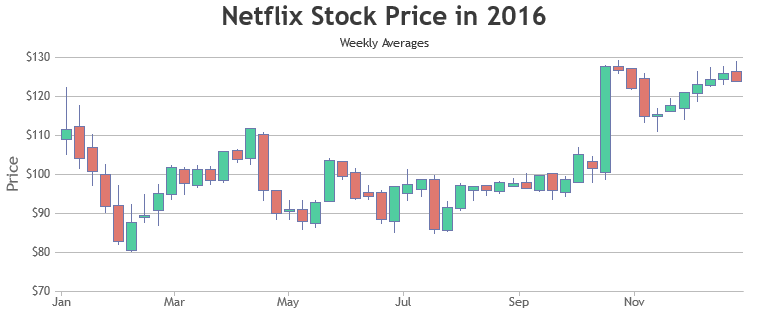
- fallingColor is introduced in candlestick chart.
- Crosshair labels are improved to avoid clipping towards the extremes of the chart.
- Improved auto-calculated spacing and range in scaleBreaks.
Change in Behaviour
- Labels are removed from scaleBreaks as they were rendered very close to axis labels. This was reducing the readability of the chart. Instead, crosshair can be used to check scale-break range.
Bug Fix:
- label property of crosshair in axisX was not working.
- When labelFormatter was used, crosshair label was not rendered for value 0.
- Axis scale break was throwing error in some cases of date-time axis.
- In some cases, secondary axisX labels were overlapping plotArea.
- Chart bounds were not updated after resize of chart.
- Zooming and Panning were not working properly in IE8.
- Chart was throwing error when combined with other libraries that modify Array.prototype.
- Auto-calculated whisker length of Error chart was not proper when linked with Range charts.
Do download the latest version from our download page and let us know your feedback.
Thank You,
Bivek Singh,
Team CanvasJS
Leave a Reply