Today we are releasing 2.0.1 GA with a few bug fixes. Below is a summary of the release.
Bug Fixes:
- Click event was firing twice in mobile devices.
- In few cases of Bar Chart, striplines were not getting rendered.
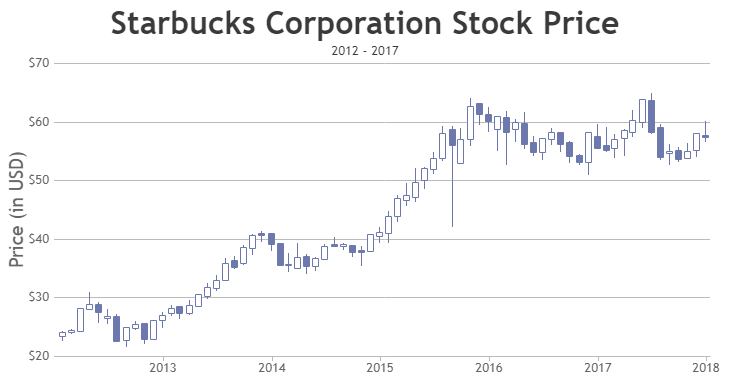
- In candlestick, ohlc, box & whisker and range charts, Y axis range was not getting updated according to data points visible after zooming along X Axis.
We have also taken time to add jQuery, ASP.NET MVC, PHP, JSP, Spring MVC Samples to the Demo Gallery with the new look and feel of revamped CanvasJS 2.0. Please take your time to have a look at the Chart Galleries.
Do download the latest version from our download page and let us know your feedback.
Thank You,
Vishwas R
Team CanvasJS
Leave a Reply