Today we are releasing 1.9.9 GA with few bug fixes. Below is a summary of the release.
Bug Fixes:
- In Line Chart, nullDataLineDashType was not working as expected in some cases.
- In few cases, Chart was throwing error when no dataPoints were present.
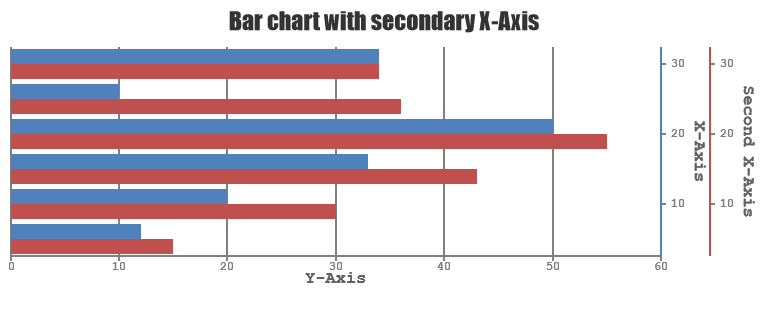
- When multiple secondary axisX were used, axis titles were not positioned properly in bar chart.
- Gridline with label 0 was drawn on top of chart, when there were no dataPoints present.
- In few touch enabled devices, events weren’t firing.
- When dataPoints were modified dynamically, viewport was not updating as expected .
- Chart was throwing error in few cases when multiple secondary axes were used.
- IndexLables were still visible if dataPoints were panned out of viewport for candleStick, OHLC, rangeArea and rangeSplineArea charts.
- For few specific cases, starting point of animation for bar and column charts was not as expected.
Do download the latest version from our download page and let us know your feedback.
Thank You,
Bivek Singh,
Team CanvasJS
Leave a Reply