Login to Ask a Question or Reply
Forum Replies Created by Indranil
-
Sorry for the inconvenience caused. As of now, there is a restriction on zooming, which we will reconsider for improvisation in future releases. For your use-case, you can set zoomType as ‘x’ for now.
___________
Indranil Deo
Team CanvasJSPlease refer to the below steps for integrating CanvasJS in Salesforce Lightning Web Components:
1. Add the CanvasJS library to the Static Resources in your Salesforce account
2. Create a Lightning Web Component following the steps mentioned in this resource
3. Once the Lightning Web Component is created you can add the below HTML and JS code in the lwc componentHTML
<template>
    <lightning-card>
        <div data-id="chartContainer" style="height: 300px; width: 100%;" lwc:dom="manual"></div>
    </lightning-card>
</template>
JS
import { LightningElement } from 'lwc';
import CanvasJS from '@salesforce/resourceUrl/CanvasJS';
import { loadScript } from 'lightning/platformResourceLoader';

export default class Salesforce_canvasjs extends LightningElement {

  canvasjsInitialized = false;
  chart;
  error;
  renderedCallback() {
    if (this.canvasjsInitialized) {
      return;
    }
    this.canvasjsInitialized = true;

    loadScript(this, CanvasJS).then(() => {
      const container = this.template.querySelector('[data-id="chartContainer"]');
      this.chart = new window.CanvasJS.Chart(container, {
        animationEnabled: true,
        title: {
          text: "Basic Column Chart in Salesforce LWC"
        },
        data: [{
          type: "column",
          dataPoints: [
            { y: 41, label: "Apple" },
            { y: 55, label: "Mango" },
            { y: 50, label: "Orange" },
            { y: 65, label: "Banana" },
            { y: 95, label: "Pineapple" },
            { y: 68, label: "Pears" },
            { y: 28, label: "Grapes" },
            { y: 34, label: "Lychee" },
            { y: 14, label: "Jackfruit" }
          ]
        }]
      });
      this.chart.render();
    }).catch((error) => {
      this.error = error;
    });
  }
}
4. Deploy the project to your Salesforce account.
You can also refer to this Github Repo for the working code on integration of CanvasJS in Lightning Web Components.
___________
Indranil Deo
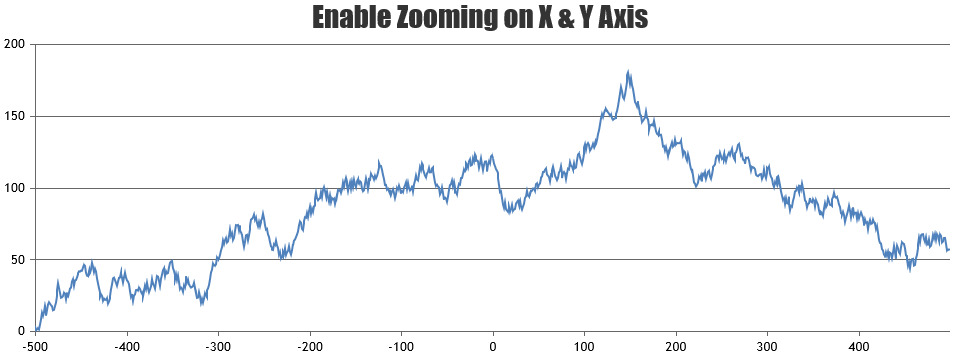
Team CanvasJSThe behavior is designed such that zooming is limited upto a certain region so that the user doesn’t end up zooming into a blank region (region with no dataPoints). To zoom into a certain region, there should be a minimum of 3-4 dataPoints over the axis.
In your case, the zoom doesn’t work as there are less than 3-4 dataPoints with different values over the axisY for the given dataSeries. We suggest you set the zoomType to x in such scenarios.
___________
Indranil Deo
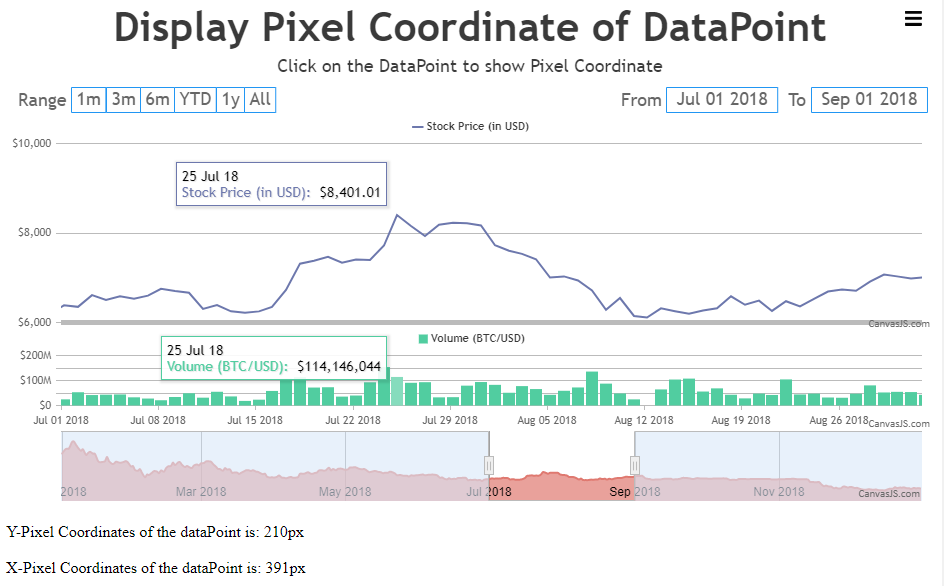
Team CanvasJSIn case of StockChart, you need to use the convertValueToPixel method with respect to individual charts to get their corresponding pixel coordinates as shown in the code snippet below –
document.getElementById("displayYPixel").innerHTML = "Y-Pixel Coordinates of the dataPoint is: " + Math.round((stockChart.charts[e.chart.index].container.offsetTop + stockChart.charts[e.chart.index].axisY[0].convertValueToPixel(e.dataPoint.y))) + "px";

document.getElementById("displayXPixel").innerHTML = "X-Pixel Coordinates of the dataPoint is: " + Math.round((stockChart.charts[e.chart.index].container.offsetLeft + stockChart.charts[e.chart.index].axisX[0].convertValueToPixel(e.dataPoint.x))) + "px";
Please check this JSFiddle for an example on displaying the pixel coordinate of a dataPoint on click.
___________
Indranil Deo
Team CanvasJSSeptember 10, 2021 at 2:03 am in reply to: Showing date in milliseconds for x-axis even if I pass date in correct format #35672Malvika,
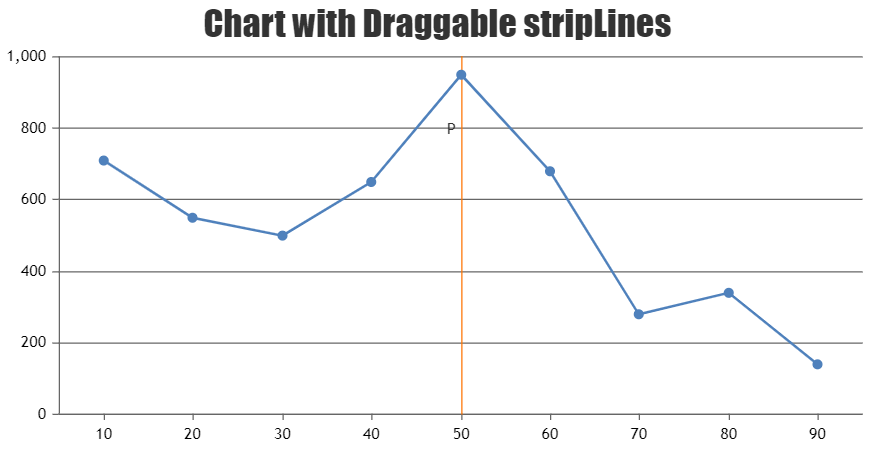
You can drag a stripLine with the help of mouse events by checking if the mousedown event was fired within the bounds of stripLine and drag the same by updating the value property within mousemove event as shown in the code snippet below –
$(".canvasjs-chart-canvas").last().on("mousedown", function(e) {
  // Get the selected stripLine & change the cursor
  var parentOffset = $(this).parent().offset();
  var relX = e.pageX - parentOffset.left;
  var relY = e.pageY - parentOffset.top;
  var snapDistance = 5;

  for(var i = 0; i < chart.options.axisX[0].stripLines.length; i++) {
    if(relX > chart.axisX[0].stripLines[i].get("bounds").x1 - snapDistance && relX < chart.axisX[0].stripLines[i].get("bounds").x2 + snapDistance && relY > chart.axisX[0].stripLines[i].get("bounds").y1 && relY < chart.axisX[0].stripLines[i].get("bounds").y2) {
      selected = i;
      $(this).css("cursor","pointer");
    }
  }
});

$(".canvasjs-chart-canvas").last().on("mousemove", function(e) {
  // Move the selected stripLine
  if(selected !== -1) {
    var parentOffset = $(this).parent().offset();
    var relX = e.pageX - parentOffset.left;
    chart.options.axisX[0].stripLines[selected].value = chart.axisX[0].convertPixelToValue(relX);
    chart.options.data[1].dataPoints[0].x = chart.options.axisX[0].stripLines[selected].value - 1;
    chart.render();
  }
});

$(".canvasjs-chart-canvas").last().on("mouseup", function(e) {
  // Clear Selection and change the cursor
  selected = -1;
  $(this).css("cursor","default");
});
Also, please check this JSFiddle for an example on draggable stripLines.
The same approach works across dynamic charts as well. Please check this thread for more information.
___________
Indranil Deo
Team CanvasJSYou can use the axis addTo method to add stripLines dynamically on click. To remove the same you can use the remove method of stripLines as shown in the code snippet below –
Adding stripLines –
chart.axisX[0].addTo("stripLines", {value: 50, showOnTop: true});Removing stripLines –
chart.axisX[0].stripLines[1].remove();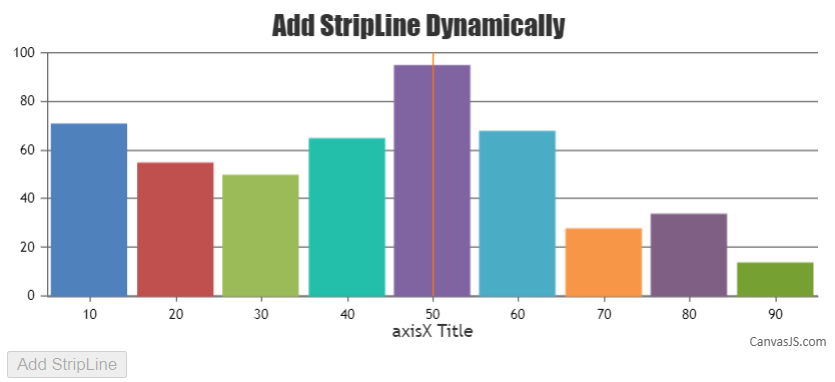
___________
Indranil Deo
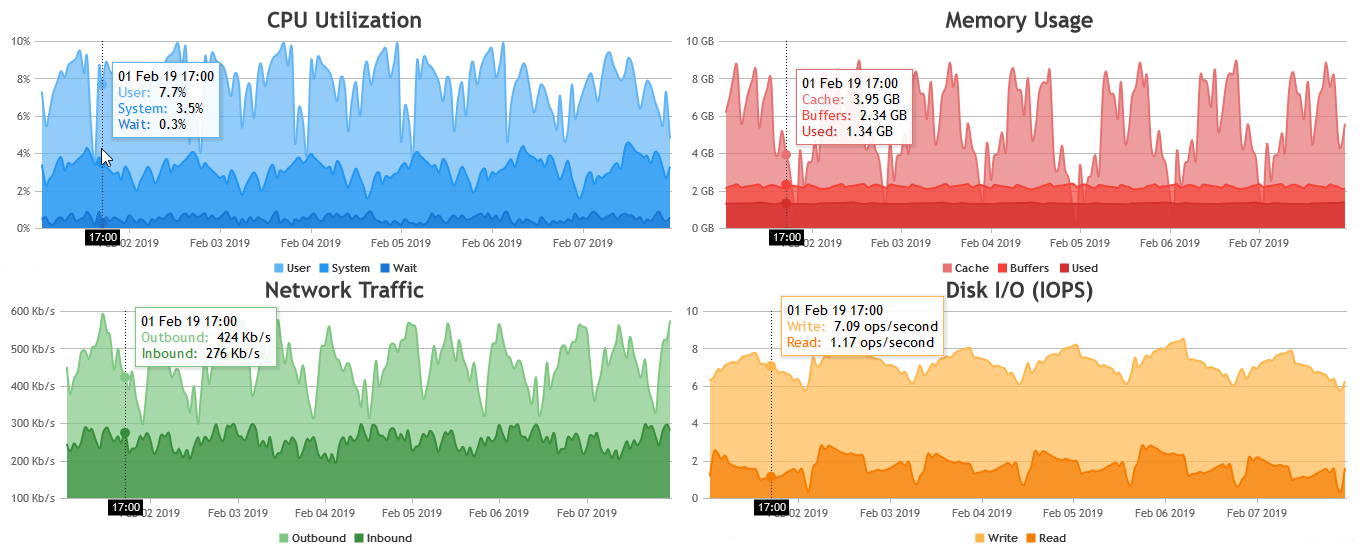
Team CanvasJSAugust 30, 2021 at 6:34 pm in reply to: Cross hair and tooltip are not in sync in MobileView Mode #35451Setting the toolTip shared and crosshair snapToDataPoint options to true seems to be working fine. Can you please try setting both the options at your end? In case you are still facing the issue, kindly create a JSFiddle reproducing the issue and share it with us so that we can look into your code, understand the scenario better and help you out.
___________
Indranil Deo
Team CanvasJSCan you please try setting the toolTip shared and crosshair snapToDataPoint options to true?
Also, based on the shared screenshot it seems you are using an older version of CanvasJS, there has been a lot of updates in the functionality of crosshair and toolTip since then. Can you please try checking with the latest version? If the issue still persists, kindly create JSFiddle reproducing the issue you are facing and share it with us so that we can look into your code, understand the scenario better and help you out.

___________
Indranil Deo
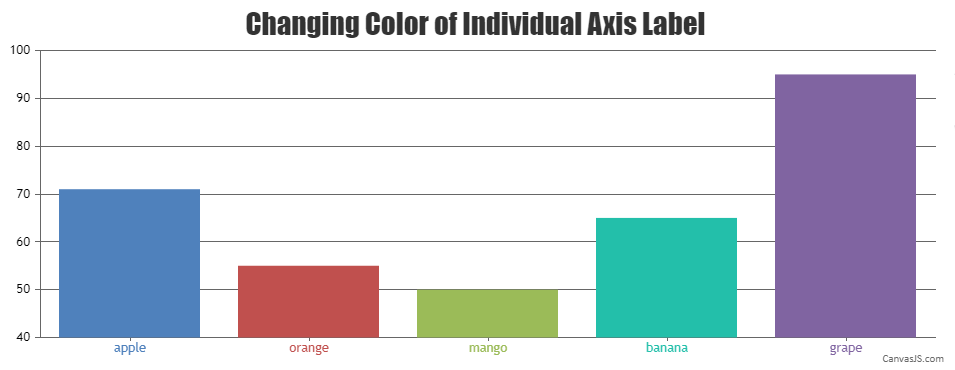
Team CanvasJSSetting font color of individual axis labels is not possible as of now. However, you can replace axis label with stripline label and set the color of each individual label using labelFontColor property as shown in the code snippet below –
function changeAxisLabelColor(chart) {
    var dps;
    for(var i = 0; i < chart.data[0].dataPoints.length; i++){
        dps = chart.data[0].dataPoints[i];
        if(dps.labelFontColor)
            chart.axisX[0].addTo("stripLines", { value: dps.x, label: dps.label, labelPlacement: "outside", labelBackgroundColor: "white", color: "transparent", labelFontColor: dps.labelFontColor });
    }
}
Please take a look at this JSFiddle for complete working code.
___________
Indranil Deo
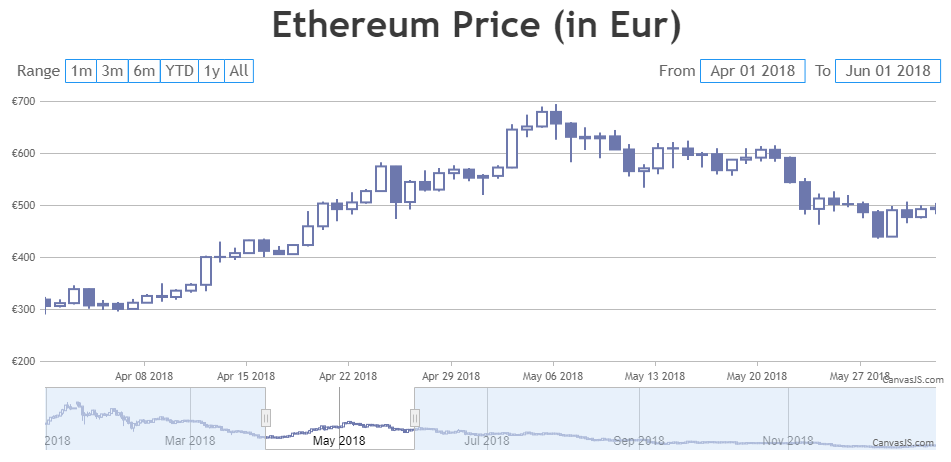
Team CanvasJSInputfields doesn’t accept time-component as of now. However startValue & endValue does and updates chart-ranges to the value passed to them. Please take a look at this JSFiddle for an example on the same.
___________
Indranil Deo
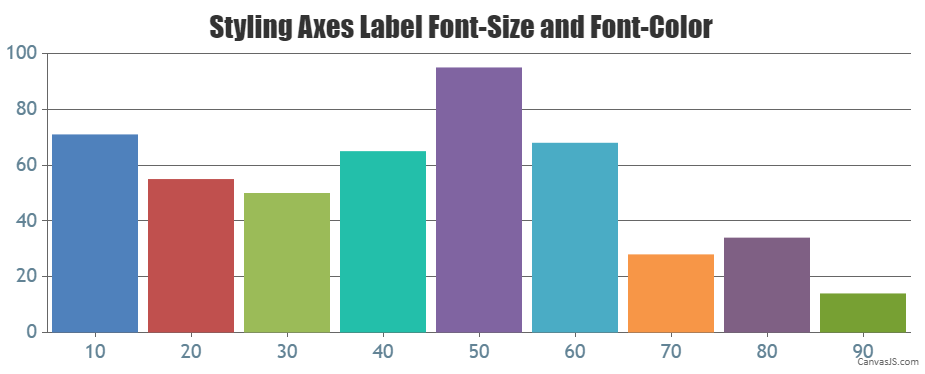
Team CanvasJSCanvasJS comes with in-build chart options to customize the chart elements. You can use the labelFontSize and labelFontColor properties to style the label font-size and font-color of both axes respectively as shown in the code snippet below –
axisX: {
  labelFontSize: 20,
  labelFontColor: "#628395"
},
axisY: {
  labelFontSize: 20,
  labelFontColor: "#628395"
},
Also, please take a look at this working JSFiddle for an example on customizing the axes label font-size and font-color.
___________
Indranil Deo
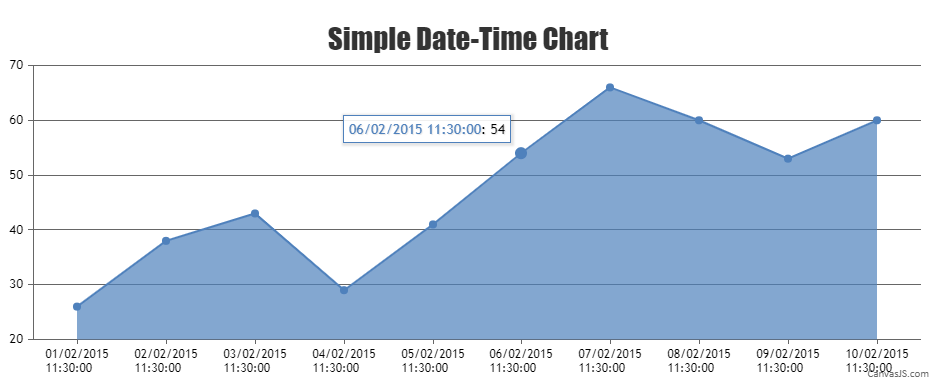
Team CanvasJSYou can use formatDate() inside contentFormatter to format the date displayed in toolTip as shown in code snippet below –
toolTip: {
  contentFormatter: function (e) {
    var content = " ";
    for (var i = 0; i < e.entries.length; i++) {
      content += "<span style='color:" + e.chart.selectedColorSet[i] + ";'>" + CanvasJS.formatDate(e.entries[i].dataPoint.label, "DD/MM/YYYY HH:mm:ss") + "</span>" + ": " + e.entries[i].dataPoint.y;
      content += "<br/>";
    }
    return content;
  }
},
Also, please take a look at this updated JSFiddle for an example on formatting date displayed inside the toolTip.
___________
Indranil Deo
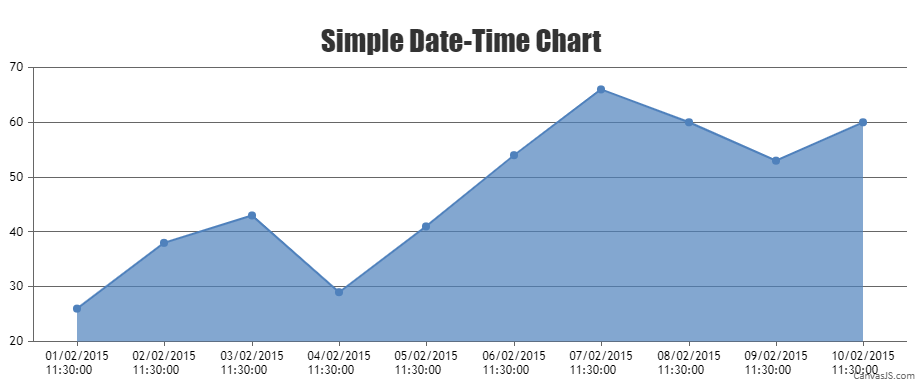
Team CanvasJSAxis labels are not rendered for every dataPoint instead its rendered at every interval. However, if you like to show label for every dataPoint, you can use label property instead of x-value as shown in the below code snippet –
{label: new Date(2015, 01, 1, 11, 30, 0), y: 26},
{label: new Date(2015, 01, 2, 11, 30, 0), y: 38},
{label: new Date(2015, 01, 3, 11, 30, 0), y: 43},
{label: new Date(2015, 01, 4, 11, 30, 0), y: 29},
Also, please take a look at this JSFiddle for an example to display date-time using label property.
___________
Indranil Deo
Team CanvasJSPlease take a look at this sample project for rendering CanvasJS Chart in ASP.NET Webforms. Refer ReadMe.txt file present in the sample project for setup related information.
If you are still facing the issue kindly create a sample project reproducing the issue and share it with us over Google-Drive or Onedrive along with sample database so that we can run it locally at our end to understand the scenario better and help you out.
___________
Indranil Deo
Team CanvasJS