Login to Ask a Question or Reply
Forum Replies Created by Indranil
-
We are looking into your query and will get back to you at the earliest.
___________
Indranil Singh Deo
Team CanvasJSCan you please let us know if you are trying to integrate CanvasJS with Classic ASP or ASP.NET?
___________
Indranil Singh Deo
Team CanvasJSYou can pass the desired variables to
$pointsas key value pairs to create an associative array as shown below –$points = array( "label" => $seqnum, "x" => $seqnum, "y" => $daysdiff, "currdate" => $currdate, "prevdate" => $prevdate, "freq" => $freq );The same variables would be available within the chart and can be accessed through the chart options –
chart.options.data[0].dataPoints[0].freq___________
Indranil Singh Deo
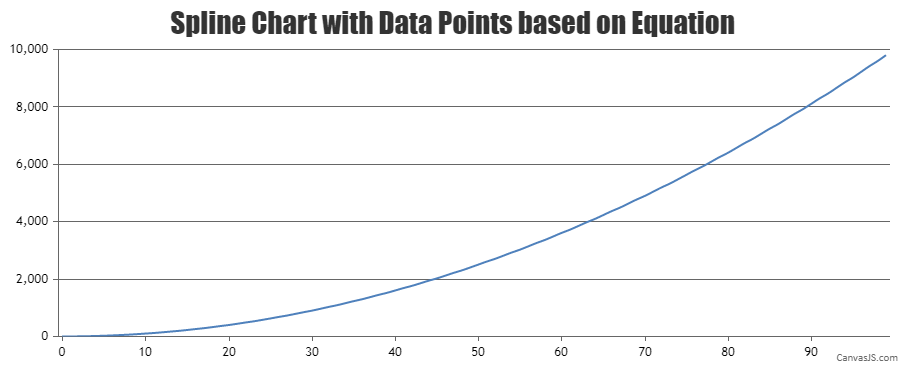
Team CanvasJSAs of now, it is not possible to render a 3-dimensional Chart. However, you can have a function with x and y values and render the chart based on the calculated dataPoints along x and y-axis as shown below –
var chart = new CanvasJS.Chart("chartContainer",{
  zoomEnabled: true,
  title:{
    text: "Spline Chart with Data Points based on Equation"
  },
  data: [{
    type: "spline",
    dataPoints: dps
  }]
});
addDataPoints();
chart.render();

function addDataPoints() {
  for (var j = 0; j < dataLength; j++) {
    xVal = j;
    yVal = Math.pow(xVal,2) +  1;
    dps.push({
      x: xVal,
      y: yVal
    });
  }
}
Please take a look at this JSFiddle for a working example.
___________
Indranil Deo
Team CanvasJSjQuery is a lightweight and feature-rich JavaScript library. With jQuery, you can achieve the same functionality with fewer lines of code compared to JavaScript. Also, jQuery has inbuilt feature of cross-browser compatibility whereas JavaScript requires extra coding to make it cross-browser compatible. To sum it up jQuery is more user-friendly compared to JavaScript.
Also, if you want to integrate CanvasJS the jQuery way you can use the CanvasJS jQuery plugin. Please check this documentation page for more information on the same.
___________
Indranil Deo
Team CanvasJSNovember 2, 2021 at 6:57 pm in reply to: How to make chart 100% width while printing on both landscape and portrait mode? #36192You can set the scale option in browser print dialog panel to fit the chart image according to your requirement. Please refer this article to enable scaling in chrome.
___________
Indranil Deo
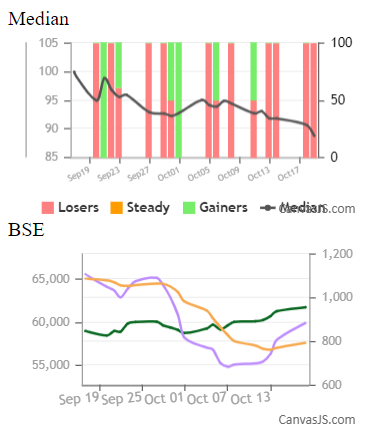
Team CanvasJSBased on the sample shared by you, the issue doesn’t seem to be related to memory consumption, instead, it looks like the date-time is not passed in a standard format because of which the charts are not rendering across all browsers. Passing the date-time in a standard format with timezone as shown below should work fine in your case –
nopointsarr.push({x:new Date(allTrend[c].replace(/-/g, "/") + " GMT+0500"), y:noportarr[c]});Please take a look at this JSFiddle for a working example.
___________
Indranil Deo
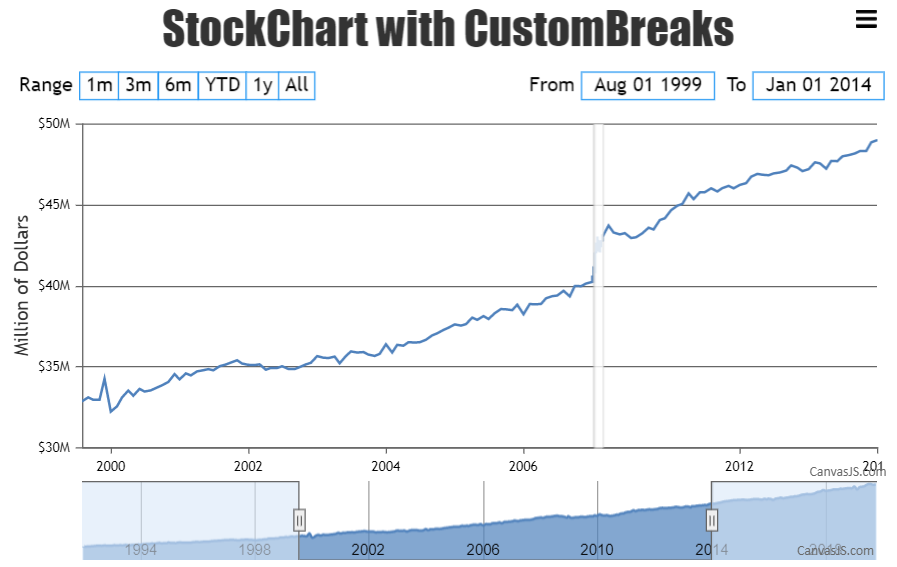
Team CanvasJSTo add customBreaks in StockChart you can specify the startValue and endValue of the region to be shrunk on respective axis for each individual charts as shown in the code snippet below –
 var stockChart = new CanvasJS.StockChart("stockChartContainer", {
    title: {
      text:"StockChart with CustomBreaks"
    },
    .
    .
    charts: [{
      axisX: {
        scaleBreaks: {
          type: "straight",
          customBreaks: [{
            startValue: new Date(2007, 00, 01),
            endValue: new Date(2010, 00, 01)
          }]
        }
      },
      .
    }],
    .
    .
  });
Please check this JSFiddle for a working example on adding customBreaks in StockChart.
___________
Indranil Deo
Team CanvasJSOctober 18, 2021 at 6:34 pm in reply to: When summer time ends Charts axis labelFormatter “skips” an entire hour #36060Juan,
Glad that modifying a part of the source-code worked for you. Since you are making changes in the source-code, we would suggest you to test the updated code with different use cases of date-time axis to make sure it doesn’t affect other functionalities that you are using.
Also, we will revisit & reconsider this behavior in future releases.
___________
Indranil Deo
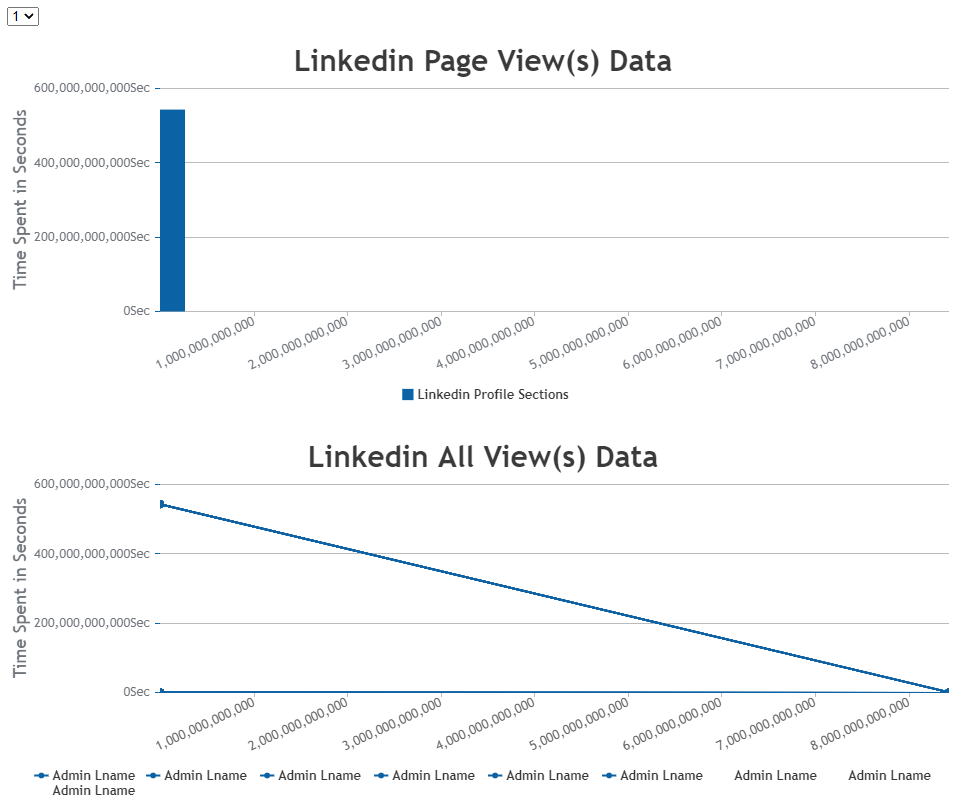
Team CanvasJSOctober 12, 2021 at 7:16 pm in reply to: type:’line’ Chart on load browser goes to expire page or wait #36023As per the JSFiddle shared by you, we can observe that based on the range of y-axis and interval option the chart is rendering too many labels which is causing the browser to freeze. Hence, removing the interval option for y-axis will allow the library to auto-calculate the interval at which axis labels are to be displayed and it should work fine in your case. Please take a look at this updated JSFiddle.
___________
Indranil Deo
Team CanvasJSOctober 9, 2021 at 4:41 am in reply to: type:’line’ Chart on load browser goes to expire page or wait #35994Rendering multiple charts in a page with different chart types seems to be working fine as shown in this documentation page. Can you kindly create a JSFiddle reproducing the issue you are facing and share it with us so that we can look into the code / chart-options being used, understand the scenario better, and help you out?

___________
Indranil Deo
Team CanvasJSOctober 8, 2021 at 6:31 pm in reply to: When summer time ends Charts axis labelFormatter “skips” an entire hour #35991Juan,
We are looking into your query and will get back to you at the earliest.
___________
Indranil Deo
Team CanvasJSYes, it is possible to render unlimited charts in a single page. Please check this documentation page for step to step tutorial on rendering multiple charts in a single page.
___________
Indranil Deo
Team CanvasJSCanvasJS jQuery plugin is just a wrapper for CanvasJS JavaScript chart, which allow you to integrate CanvasJS Charts the jQuery way i.e.
$("selector").someAction().There are no side-effects or any difference between them apart from the way it’s been used. With jQuery plugin you can get a reference to the chart object through the DOM element using
$("#myChartContainer").CanvasJSChart();if it’s created using jQuery plugin ($("#myChartContainer").CanvasJSChart(chartOptions);).___________
Indranil Deo
Team CanvasJSBased on the code sample shared by you, it seems like you are trying to create the chart in JavaScript way and using the jQuery plugin to get a reference to the chart object. Instead, you can create the chart in jQuery way using
$("#chartContainer").CanvasJSChart(options);then get a reference to the chart object using$("#chartContainer").CanvasJSChart();. Please take a look at this documentation page for more information on creating chart using the jQuery plugin.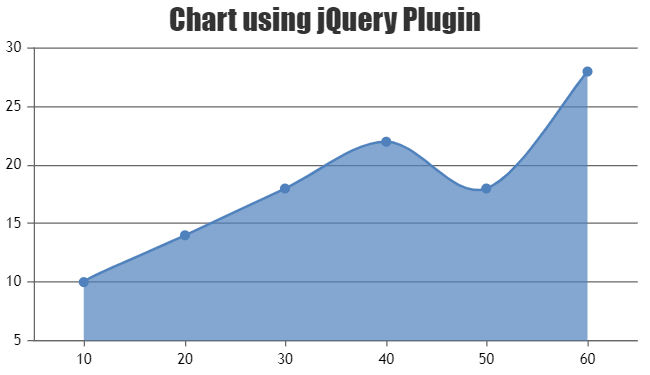
___________
Indranil Deo
Team CanvasJS