Login to Ask a Question or Reply
Forum Replies Created by Indranil
-
Tanguy,
You are welcome. Please let me know if you have any more queries.
___________
Indranil Deo,
Team CanvasJSTanguy,
Please download the code from the following link.
Create a database named chart, then replace the chart.mdf and chart_log.ldf with the files present in the database folder.
Also, please go through this link for converting datetime from SQL-server in javascript.
___________
Indranil Deo,
Team CanvasJS-
This reply was modified 8 years, 11 months ago by
Indranil.
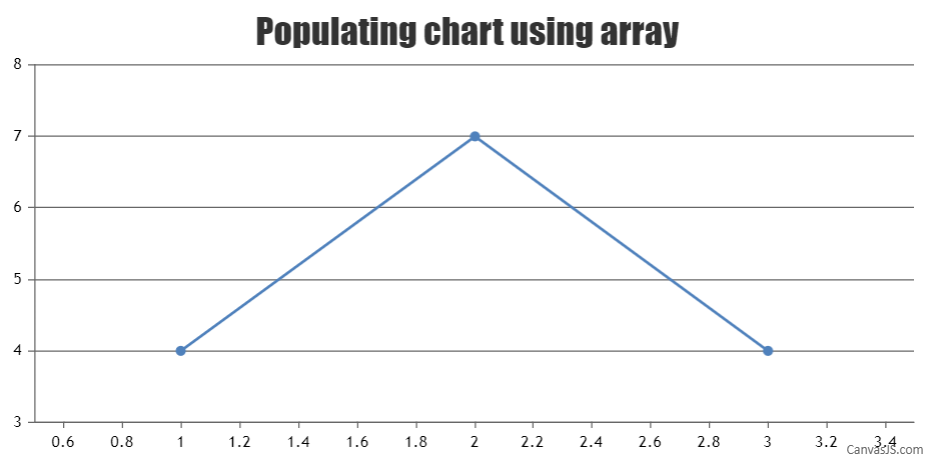
To populate chart from array you can loop through the array and parse it to the format accepted by CanvasJS before passing to the chart options as shown below –
var x1 = [1, 2, 3];
var y1 = [4, 7, 4];
var dataPoints = [];

for (var i = 0; i < 3; i++) {
  dataPoints.push({
    x: x1[i],
    y: y1[i]
  });
}
Please take a look at this JSFiddle for an example.
___________
Indranil Deo
Team CanvasJSSorry, this feature is not available as of now.
___________
Indranil Deo,
Team CanvasJSCandlestick chart needs 4 values i.e. Open, High, Low & Close.
The CSV data that you have provided has only one y value. Please provide the CSV data in the above-mentioned format.
____________
Indranil Deo,
Team CanvasJSRange Column chart can be used to show the difference between the two successive dataPoints.
Please take a look at this example.
____________
Indranil Deo,
Team CanvasJSAugust 14, 2017 at 3:15 pm in reply to: Using StackedArea100 % chart not covering full background #15816Saran,
Yes, multiple axis is available in CanvasJS. Please go through this page for more information.
To display a bar from the middle of axisX you can use Range Bar chart.
____________
Indranil Deo,
Team CanvasJSAugust 14, 2017 at 12:35 pm in reply to: How can I get the current x-value of my mouse when it is over a line graph? #15815Adding click event to axis label is not possible as of now. If the y value of a dataPoint is set to 0, the representation of dataPoint is not visible at all. That’s why it is almost impossible to click that dataPoint and fire an event.
If you are using column/bar type of chart, you can use scatter chart for dataPoints that equals to zero. You can set marker size and would be able to click that marker. Please take a look at this jsFiddle.____________
Indranil Deo,
Team CanvasJSPlease take a look at this example.
Also, you need to set the the third parameter i.e. updateChart to
falsein set() method. Please refer this documentation page for more information on set().shahnawaz,
You can refer these samples for fetching data from server.
____________
Indranil Deo,
Team CanvasJS@thiago.hernandes,
Please refer this stackoverflow thread to set the layout to landscape by default. If you use CTRL+P the page will be printed in landscape mode. However, it not consistent across different browsers, as of now.
____________
Indranil Deo,
Team CanvasJS -
This reply was modified 8 years, 11 months ago by