Login to Ask a Question or Reply
You must be logged in to post your query.
Home › Forums › Chart Support › How to show the time and date on xAxis
How to show the time and date on xAxis
- This topic has 6 replies, 4 voices, and was last updated 2 years, 8 months ago by
Thangaraj Raman.
Tagged: date and time, line chart
-
July 27, 2021 at 9:19 pm #34951
Hi guys,
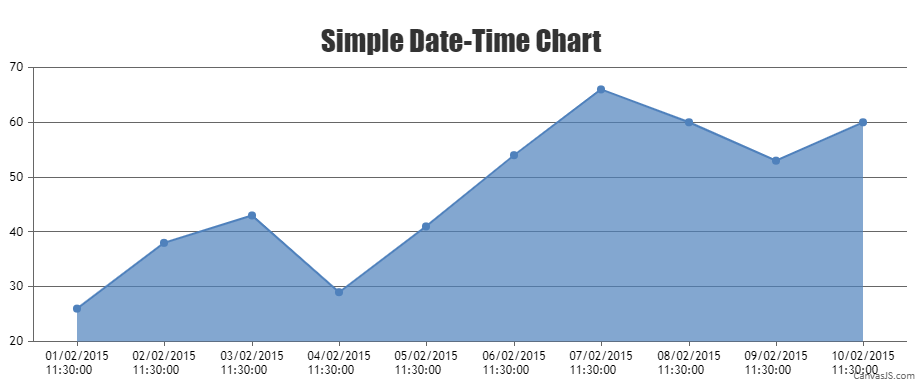
I am using like this code `var chart = new CanvasJS.Chart(“chartContainer”, {
title:{
text: “Simple Date-Time Chart”
},
axisX:{
valueFormatString: “DD/MM/YY HH:mm:ss”,
intervalType: “day”,
interval: 2.5
},
data: [
{
type: “area”,
xValueFormatString: “DD/MM/YYYY HH:mm:ss”,
dataPoints: [//array
{ x: new Date(2015, 01, 1, 11, 30, 00 ), y: 26},
{ x: new Date(2015, 01, 2, 11, 30, 00 ), y: 38},
{ x: new Date(2015, 01, 3, 11, 30, 00 ), y: 43},
{ x: new Date(2015, 01, 4, 11, 30, 00 ), y: 29},
{ x: new Date(2015, 01, 5, 11, 30, 00 ), y: 41},
{ x: new Date(2015, 01, 6, 11, 30, 00 ), y: 54},
{ x: new Date(2015, 01, 7, 11, 30, 00 ), y: 66},
{ x: new Date(2015, 01, 8, 11, 30, 00 ), y: 60},
{ x: new Date(2015, 01, 9, 11, 30, 00 ), y: 53},
{ x: new Date(2015, 01, 10, 11, 30, 00 ), y: 60}]
}
]
});chart.render();`
but the time on x axis is 12:00 in all points how can I make it to match the value as in the code?
July 28, 2021 at 3:38 am #34954Axis labels are not rendered for every dataPoint instead its rendered at every interval. However, if you like to show label for every dataPoint, you can use label property instead of x-value as shown in the below code snippet –
{label: new Date(2015, 01, 1, 11, 30, 0), y: 26},
{label: new Date(2015, 01, 2, 11, 30, 0), y: 38},
{label: new Date(2015, 01, 3, 11, 30, 0), y: 43},
{label: new Date(2015, 01, 4, 11, 30, 0), y: 29},
Also, please take a look at this JSFiddle for an example to display date-time using label property.
___________
Indranil Deo
Team CanvasJSJuly 28, 2021 at 5:48 pm #34959Yes it works many thanks bro!
But is there anyway I can remove the GMT (Standard Arabia time) from the lable?
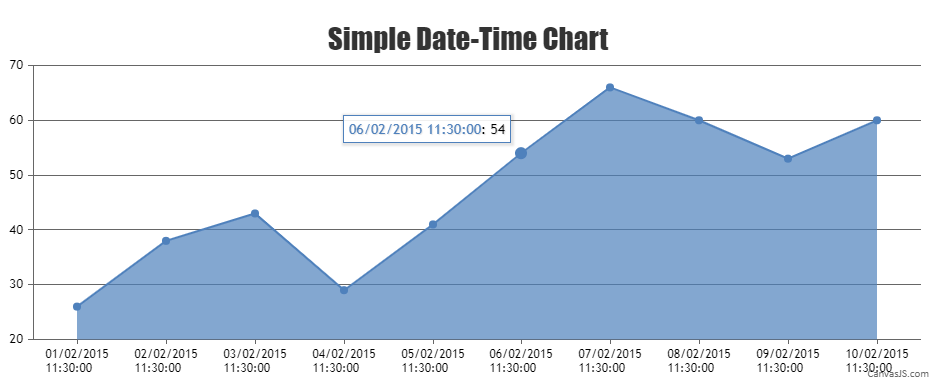
July 28, 2021 at 7:46 pm #34965You can use formatDate() inside contentFormatter to format the date displayed in toolTip as shown in code snippet below –
toolTip: {
  contentFormatter: function (e) {
    var content = " ";
    for (var i = 0; i < e.entries.length; i++) {
      content += "<span style='color:" + e.chart.selectedColorSet[i] + ";'>" + CanvasJS.formatDate(e.entries[i].dataPoint.label, "DD/MM/YYYY HH:mm:ss") + "</span>" + ": " + e.entries[i].dataPoint.y;
      content += "<br/>";
    }
    return content;
  }
},
Also, please take a look at this updated JSFiddle for an example on formatting date displayed inside the toolTip.
___________
Indranil Deo
Team CanvasJSJuly 28, 2021 at 11:25 pm #34966Thanks it works!
October 15, 2023 at 10:08 am #43888How to show date and time on tooltip with shared mode when graph is shared with multiple plots?
October 16, 2023 at 6:54 pm #43897By default, date-time values are shown in the tooltip, even when the tooltip is shared. You can use xValueFormatString to define the format of the date to be displayed in the tooltip.
—
Thangaraj Raman
Team CanvasJS
Tagged: date and time, line chart
You must be logged in to reply to this topic.