Login to Ask a Question or Reply
Forum Replies Created by Indranil
-
nikunj,
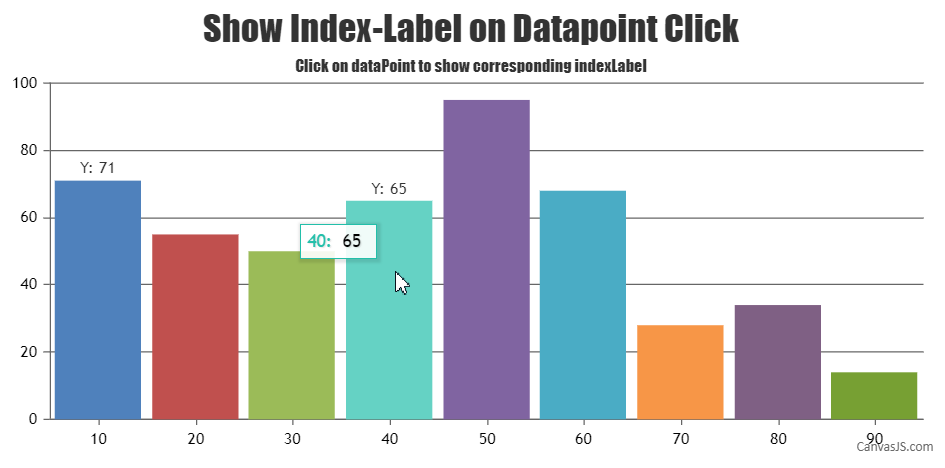
You can use click event handler for adding indexLabel to dataPoint that is clicked. Please check the code snippet below –
function onClick(e){
  e.dataPoint.indexLabel = "Y: " + e.dataPoint.y;
  e.chart.render();
}
Also, kindly check this JSFiddle for adding indexLabel on clicking specific dataPoint.
___________
Indranil Deo
Team CanvasJSJuly 28, 2017 at 11:46 am in reply to: Is there a way to move the y axis labels to the inside of the axis? #15685@ayy,
This feature is not available as of now. But you can workaround using stripLines. Please have a look at this example.
————-
Indranil Deo
Team CanvasJSParag,
Can you kindly create jsfiddle along with the data, so that we can understand and help you out better.
————
Indranil Deo
Team CanvasJS@Hannah,
Thanks for reporting. We are looking into the issue. We will get back to you at the earliest.
————-
Indranil Deo
Team CanvasJSAs of now it is not possible to have different font style in the same indexLabel.
Also drawing grid lines only between dataPoint and axis is not possible as of now. However, you can take a look at this work-around.
__
Indranil Deo
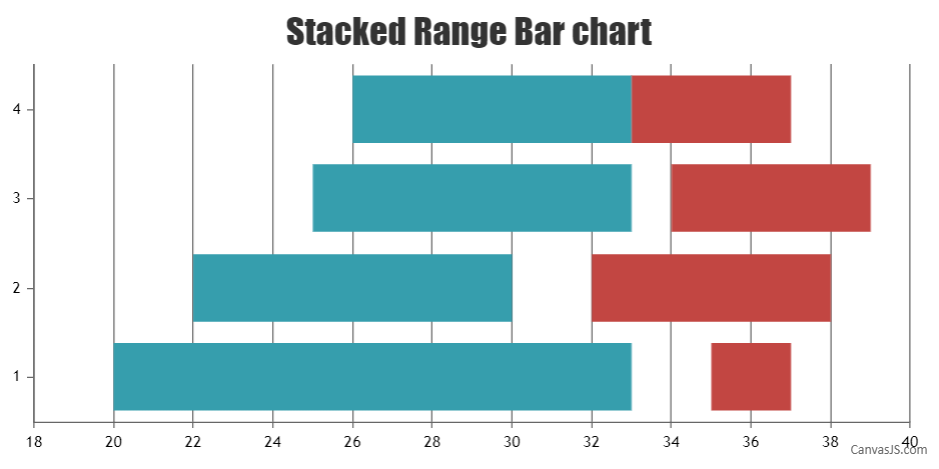
Team CanvasJSFor Range Bar Chart, you can take a look at this documentation page.
In case you are looking for Stacked Range Bar Chart, we don’t have it out of the box yet. But you can take a look at this work-around to achieve the same using Range Bar Chart.
___________
Indranil Deo
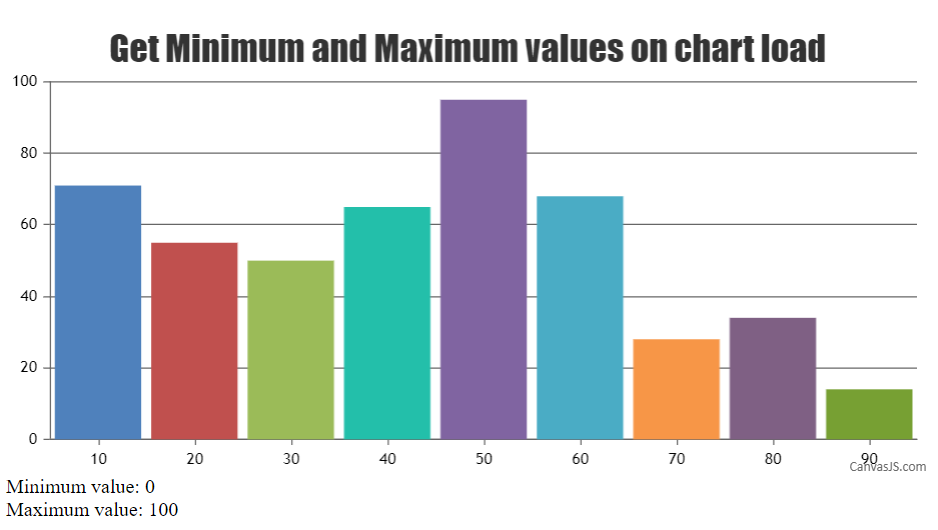
Team CanvasJSYou can use get() to fetch the minimum and maximum values of the axisY as shown in the code snippet below –
var max = chart.axisY[0].get("maximum");
document.getElementById("displayMaximum").innerHTML = max;
var min = chart.axisY[0].get("minimum");
document.getElementById("displayMinimum").innerHTML = min;
Also, please take a look at this JSFiddle for complete working code.
___________
Indranil Deo
Team CanvasJSYou can set name of books in the toolTip by using toolTip contentFormatter.
You can also modify the toolTipContent using toolTipContent at dataPoint or dataSeries level.
—-
Indranil Deo,
Team CanvasJS-
This reply was modified 8 years, 11 months ago by
Indranil.
@Anthony,
This is expected because rendering of scatter charts is relatively slower than line charts as it takes more processing.
And the same applies to the markerType as rendering of circle and triangle requires more calculation.___
Indranil Deo
Team CanvasJSThis feature is not available out of the box as of now. However, you can take a look at this work-around.
—
Indranil Deo
Team CanvasJSPlease download the sample project.
1.Database.sql is the database file you need to import it in database.
2.index.php creates Charts using JSON Data from an external source(service.php).
3.service.php extracts data from database, uses JSON to parse the data and send it to index.php.___
Indranil Deo
Team CanvasJS -
This reply was modified 8 years, 11 months ago by