Today, we are excited to announce the release of CanvasJS StockChart v1.0 & Chart v3.0. Below is a summary of this release.
Chart Release Update
New Features & Improvements
- labelPlacement – to position axis labels either inside or outside the plot-area.
- tickPlacement – to position axis ticks either inside or outside the plot-area.
- updated & hidden events in crosshair.
- showAt & hide methods in crosshair – to programmatically show crosshair at a specified x/y value & to hide it.
- Getter & Setter methods in crosshair.
- updated & hidden events in toolTip.
- showAtX & hide methods in toolTip – to programmatically show toolTip at a specified x-value in dataSeries & to hide it.
- Syncing Tooltip & Crosshair across multiple charts.
StockChart Release Update
New Features & Improvements
- Supports all the features available in Charts.
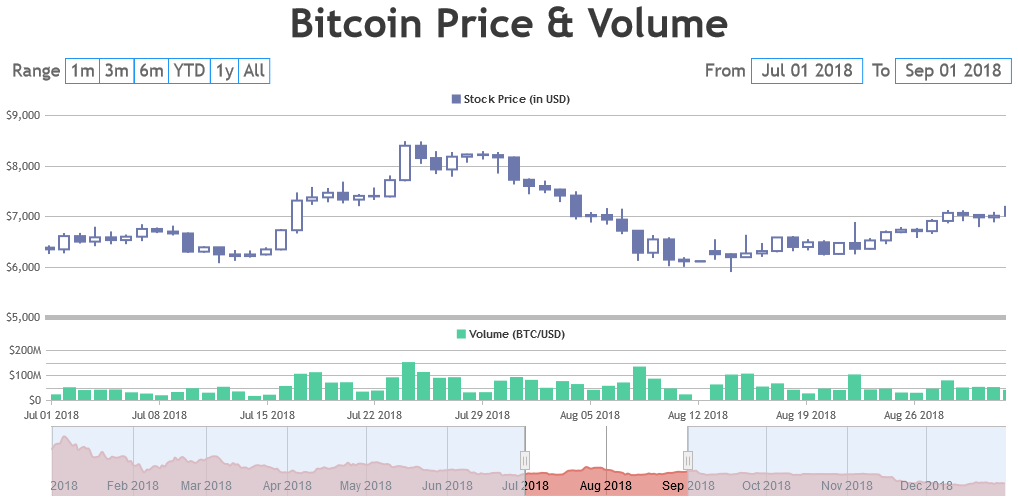
- Range Selector & Navigator – lets you control range of data to be shown in viewport of all the charts.
- Supports multiple Charts within a StockChart.
- Synchronizes Tooltip & Crosshair across multiple charts by default.
- Supports exporting entire StockChart as image in JPG / PNG format or printing it on the client-side.
- Methods & Properties in StockChart.
- jQuery Plugin for StockChart.
- React Wrapper for StockChart.
Checkout Chart v3.0 Release Blog & StockChart v1.0 Release Blog for complete list of features, improvements & bug-fixes that are available.
Introductory Offer: Get 20% OFF on StockChart license using coupon code STOCK20 before 20th October 2020.
Do download the latest version from our download page and let us know your feedback.
Thank You,
Vishwas R
Team CanvasJS
Leave a Reply