Angular Line Charts & Graphs
Angular Line Charts are plotted by connecting adjacent datapoints with a line - works well for either large or small number of data points. Line Charts are generally used to show the trends, historical data or to compare two different data sets. Angular Chart Component allows you to customize charts with smooth-curved lines called Spline Chart or with staircase shaped lines called Step-Line Charts. You can easily switch between these chart-types by changing type property in dataseries.
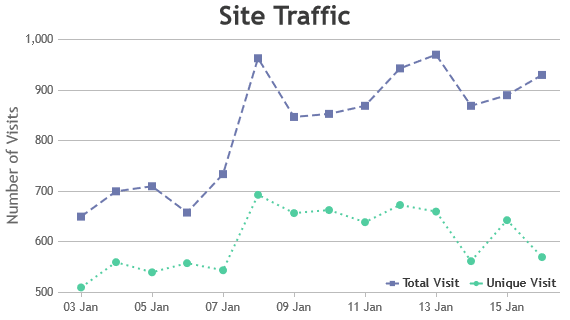
Markers are generally shown for all the datapoints when there are less number of datapoints & it's hidden when the number of datapoints are large. Markers can even be added to individual datapoint to highlight it - this is helpful in showing a spike in traffic, price, etc. A set of datapoints can even be highlighted by changing the color of connecting line between those datapoints. Graphs also supports features like zooming / panning, exporting chart as image, animation, etc.
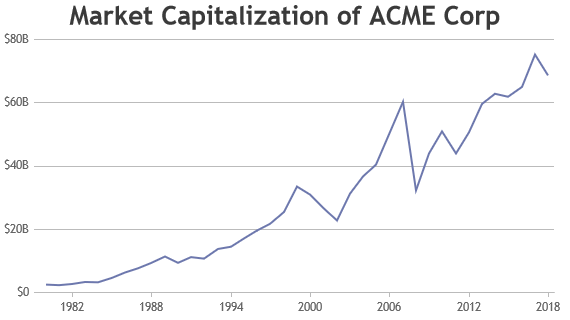
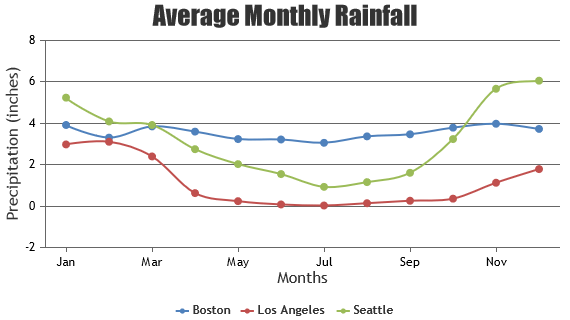
Angular Line Chart
Line Charts (also referred as Line Plot or Line Graph) are drawn by connecting adjacent datapoints with a straight line.
Angular Spline Chart
Spline Charts are also called as Smooth Curved Line Chart as the line connecting datapoints have smooth curves.
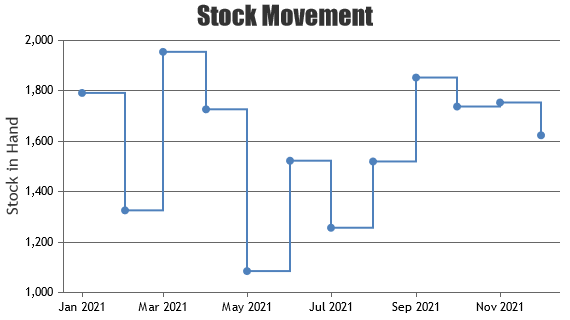
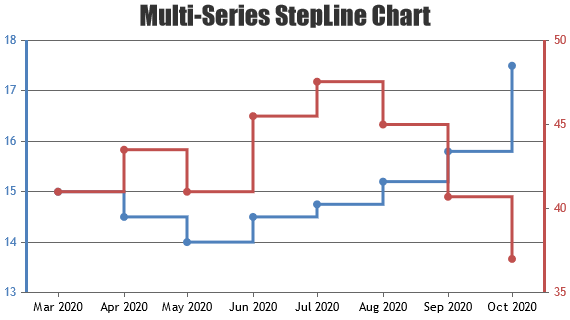
Angular Step Line Chart
Step Line Charts are also known as step charts & sometimes staircase chart because of it’s shape.
Features used Commonly in Angular Line Chart
Most commonly used features in Angular Line Chart includes zooming, panning, customizing color, thickness & dash-type of the line, adding markers, etc.
- Zooming & Panning can be enabled by setting zoomEnabled property to true.
- Color of the connecting line can be changed by setting color property.
- Thickness of the line can be changed by setting lineThickness property.
- Dash type of the line supports solid, dashed, dotted & can be changed using lineDashType property
- Markers can be shown to a particular datapoint by setting markerSize property.
- Color of the marker can be changed by setting markerColor property
- You can use includeZero to make sure the axisY range is set that zero is part of it.
How to Improve Performance of Angular Line Chart?
In most of the cases Angular Line Charts render faster with default options of the library when you have datapoint in the range of 100,000. However, if you are rendering very large number of datapoints, there are few tweaks that you can do in order to make the chart render faster.
- Avoid showing markers for all the datapoints if there are large number of datapoints. First of all it doesn’t look good when there are large number of datapoints. On top of that, it makes the chart slow.
- In case of Dynamic Charts, don’t re-create chart each time you have to add a new datapoint. Instead, update the datapoints array & call render() method of chart.
Angular Line Chart Types
General Tips for Angular Line Charts
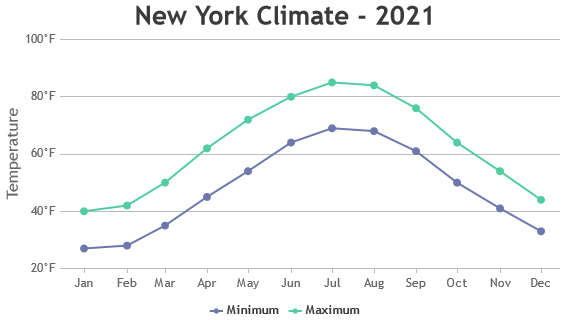
- Use multiple axes when two dataseries have different units / scale ranges.
- Having too many series in a chart makes it look cluttered. Experts suggest to have not more than 4 series in a chart.
- When you have more than 4 series, allow users to hide/unhide any series by clicking the legend
- It is recommended to sort datapoints in ascending order of x values.
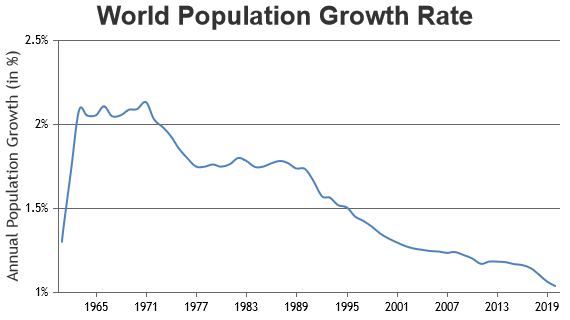
- Show zero baseline in vertical axis if and only if it’s required. Line charts should ideally show changes / variation in value clearly. Including zero in y-axis might not show the variation properly when the variation in y values are small compared to their values.

- In some cases using spline chart can remove the perception of the trend. Try using Line Chart in such cases. Below is an image showing the misunderstanding in the steepness.
