• Demos
    • JavaScript Charts
    • JavaScript StockCharts
  • Download
    • Download Chart
    • Download StockChart
  • Integrations
    • Front End Technology Samples
      • React Charts
      • Angular Charts
      • Vue.js Charts New!
      • jQuery Charts
      • Dashboards
    • Server Side Technology Samples
      • PHP Charts
      • Python Charts New!
      • ASP.NET MVC Charts
      • Spring MVC Charts
      • JSP Charts
  • License
  • Blog
  • Docs
    • Chart Documentation
    • StockChart Documentation
  • Support Forum
    • Chart Support
    • StockChart Support
  • My Account
  • My Account
  • KEY FEATURES
    • Chart with Index / Data Label
    • Chart with Zooming & Panning
    • Multi Series Chart
    • Chart with Multiple Axes
    • Combination Charts
    • Chart with Animation
    • Chart with Logarithmic Axis
    • Dynamic Chart
    • Chart with Data from AJAX
    • Drilldown Chart
    • Responsive Chart
    • Synchronized Charts
  • LINE CHARTS
    • Line Chart with Date-Time Axis
    • Dashed Line Chart
    • Multi Series Line Chart
    • Spline Chart
    • Multi Series Spline Chart
    • Step Line Chart
    • Multi Series Step Line Chart
  • BAR CHARTS
    • Bar Chart with Category Axis
    • Multi Series Bar Chart
    • Stacked Bar Chart
    • Stacked Bar 100% Chart
    • Stacked Bar 100% Chart with Indexlabels
  • COLUMN CHARTS
    • Column Chart with Numeric Axis
    • Multi Series Column Chart
    • Stacked Column Chart
    • Stacked Column 100% Chart
    • Stacked Column 100% Chart with Indexlabel
    • Waterfall Chart
    • Waterfall Chart with Indexlabels
    • Multi Series Waterfall Chart
  • PIE & DOUGHNUT CHARTS
    • Pie Chart with Index Labels
    • Pie Chart in Dark Theme
    • Doughnut Chart with Index Labels
    • Doughnut Chart in Dark Theme
  • AREA CHARTS
    • Area Chart with Indexlabels
    • Multi Series Area Chart
    • Spline Area Chart
    • Multi Series Spline Area Chart
    • Step Area Chart
    • Stacked Area Chart
    • Stacked Area 100% Chart
  • RANGE CHARTS
    • Range Column Chart
    • Multi Series Range Column Chart
    • Range Bar Chart
    • Multi Series Range Bar Chart
    • Range Area Chart
    • Multi Series Range Area Chart
    • Range Spline Area Chart
    • Multi Series Range Spline Area Chart
  • BUBBLE & SCATTER CHARTS
    • Bubble Chart with Indexlabels
    • Bubble Chart with 3 Dimensional Data
    • Multi Series Scatter Chart
  • FUNNEL & PYRAMID CHARTS
    • Funnel Chart with Index Labels
    • Funnel Chart without Neck
    • Pyramid Chart with Index Labels
  • FINANCIAL CHARTS
    • Candlestick Chart
    • Multi Series Candlestick Chart
    • OHLC Chart
    • OHLC Chart from JSON data
    • Box & Whisker Chart
  • COMBINATION CHARTS
    • Error Bar Chart
    • Pareto Chart
    • Range Area & Line Chart
    • Candlestick & Line Chart
    • OHLC Chart with Trend
  • DYNAMIC CHARTS
    • Dynamic / Live Line Chart
    • Dynamic / Live Column Chart
    • Dynamic / Live Multi Series Chart
  • JAVASCRIPT, REACT, VUE.JS, JQUERY
    • JavaScript Charts
    • React Charts
    • Vue.js Charts
    • jQuery Charts
  • SERVER SIDE TECHNOLOGIES
    • ASP.NET MVC Charts
    • JSP Charts
    • PHP Charts
    • Python Charts
    • Spring MVC Charts

Angular Funnel Chart & Pyramid Chart

Download Angular Chart Samples
  • Angular Chart Samples
  • JavaScript Chart Samples
  • React Chart Samples
  • Vue.js Chart Samples
  • jQuery Chart Samples
  • PHP Chart Samples
  • Python Django Chart Samples
  • ASP.NET Chart Samples
  • JSP Chart Samples
  • Spring MVC Chart Samples
  • Dashboard Samples
  • JavaScript StockChart Samples

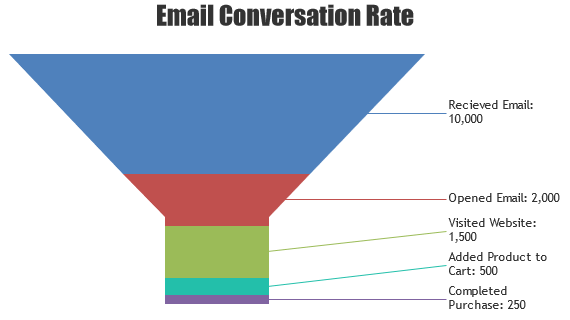
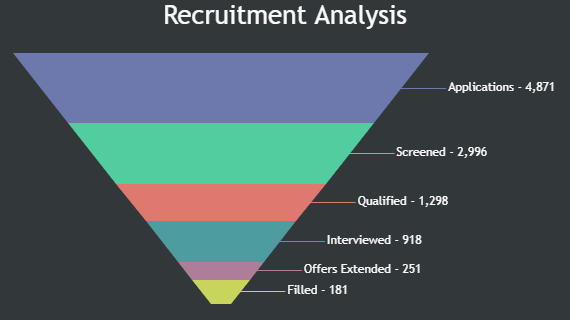
Angular Funnel Chart displays progressive decrease of data as it goes from one stage of a process to another. One of the common use of Funnel Chart is in sales & marketing reports where it is used to show the number of potential sales prospects at each stage of sales cycle. The declining number of participants at each stage is reflected in the size of that segment of the funnel chart.

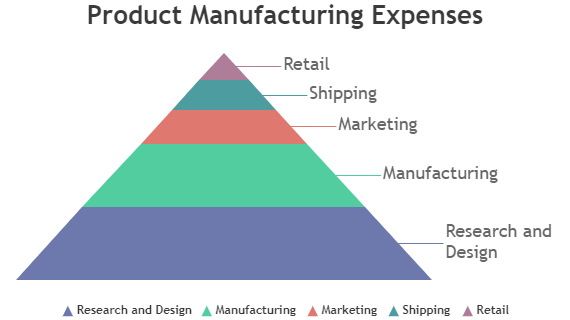
Angular Pyramid Charts are reversed funnels with no neck. Funnel & Pyramid Charts are often used to illustrate stages within a process that are linear, connected and sequential.

Angular Funnel Charts

Funnel charts display progressive decrease of data in hierarchical structure.

Angular Funnel Chart with Index Labels
Funnel Chart with Index Labels
Angular Funnel Chart without Neck
Funnel Chart without Neck

Angular Pyramid Charts

Pyramids are reversed funnel chart with no neck.

Angular Pyramid Chart with Index Labels
Pyramid Chart with Index Labels

Features used Commonly in Angular Funnel & Pyramid Charts

Most commonly used features in Angular Funnel & Pyramid Charts include valueRepresents, neckWidth, neckHeight, exploded, explodeOnClick, etc.

  • valueRepresents property lets you specify whether values in Funnel / Pyramid Charts are proportional to respective section’s height or area.
  • Neck width & height can be controlled by setting neckWidth & neckHeight properties.
  • Section of the Funnel / Pyramid chart can be exploded on initial render by setting exploded property.
  • explodeOnClick property lets you decide whether the section should explode on clicking it or not.

Angular Funnel & Pyramid Chart Types

  • Angular Funnel Chart
  • Angular Pyramid Chart

General Tips for Angular Funnel & Pyramid Charts

  • Include atleast 3 stages. When there are only two stages in a process, we only have a single ratio to comprehend. It’s better to use pie chart in such scenarios.
© fenopix
  • About Us
  • FAQs
  • Careers
  • Privacy Policy
Server Side Technologies
  • ASP.NET MVC Charts
  • PHP Charts
  • JSP Charts
  • Spring MVC Charts
Front End Technologies
  • JavaScript Charts
  • jQuery Charts
  • React Charts
  • Angular Charts
  • JavaScript StockCharts
Contact
  • Fenopix, Inc.
  • 2093 Philadelphia Pike,
  • #5678, Claymont,
  • Delaware 19703
  • United States Of America