• Demos
    • JavaScript Charts
    • JavaScript StockCharts
  • Download
    • Download Chart
    • Download StockChart
  • Integrations
    • Front End Technology Samples
      • React Charts
      • Angular Charts
      • Vue.js Charts New!
      • jQuery Charts
      • Dashboards
    • Server Side Technology Samples
      • PHP Charts
      • Python Charts New!
      • ASP.NET MVC Charts
      • Spring MVC Charts
      • JSP Charts
  • License
  • Blog
  • Docs
    • Chart Documentation
    • StockChart Documentation
  • Support Forum
    • Chart Support
    • StockChart Support
  • My Account
  • My Account
  • KEY FEATURES
    • Chart with Index / Data Label
    • Chart with Zooming & Panning
    • Multi Series Chart
    • Chart with Multiple Axes
    • Combination Charts
    • Chart with Animation
    • Chart with Logarithmic Axis
    • Dynamic Chart
    • Chart with Data from AJAX
    • Drilldown Chart
    • Responsive Chart
    • Synchronized Charts
  • LINE CHARTS
    • Line Chart with Date-Time Axis
    • Dashed Line Chart
    • Multi Series Line Chart
    • Spline Chart
    • Multi Series Spline Chart
    • Step Line Chart
    • Multi Series Step Line Chart
  • BAR CHARTS
    • Bar Chart with Category Axis
    • Multi Series Bar Chart
    • Stacked Bar Chart
    • Stacked Bar 100% Chart
    • Stacked Bar 100% Chart with Indexlabels
  • COLUMN CHARTS
    • Column Chart with Numeric Axis
    • Multi Series Column Chart
    • Stacked Column Chart
    • Stacked Column 100% Chart
    • Stacked Column 100% Chart with Indexlabel
    • Waterfall Chart
    • Waterfall Chart with Indexlabels
    • Multi Series Waterfall Chart
  • PIE & DOUGHNUT CHARTS
    • Pie Chart with Index Labels
    • Pie Chart in Dark Theme
    • Doughnut Chart with Index Labels
    • Doughnut Chart in Dark Theme
  • AREA CHARTS
    • Area Chart with Indexlabels
    • Multi Series Area Chart
    • Spline Area Chart
    • Multi Series Spline Area Chart
    • Step Area Chart
    • Stacked Area Chart
    • Stacked Area 100% Chart
  • RANGE CHARTS
    • Range Column Chart
    • Multi Series Range Column Chart
    • Range Bar Chart
    • Multi Series Range Bar Chart
    • Range Area Chart
    • Multi Series Range Area Chart
    • Range Spline Area Chart
    • Multi Series Range Spline Area Chart
  • BUBBLE & SCATTER CHARTS
    • Bubble Chart with Indexlabels
    • Bubble Chart with 3 Dimensional Data
    • Multi Series Scatter Chart
  • FUNNEL & PYRAMID CHARTS
    • Funnel Chart with Index Labels
    • Funnel Chart without Neck
    • Pyramid Chart with Index Labels
  • FINANCIAL CHARTS
    • Candlestick Chart
    • Multi Series Candlestick Chart
    • OHLC Chart
    • OHLC Chart from JSON data
    • Box & Whisker Chart
  • COMBINATION CHARTS
    • Error Bar Chart
    • Pareto Chart
    • Range Area & Line Chart
    • Candlestick & Line Chart
    • OHLC Chart with Trend
  • DYNAMIC CHARTS
    • Dynamic / Live Line Chart
    • Dynamic / Live Column Chart
    • Dynamic / Live Multi Series Chart
  • JAVASCRIPT, REACT, VUE.JS, JQUERY
    • JavaScript Charts
    • React Charts
    • Vue.js Charts
    • jQuery Charts
  • SERVER SIDE TECHNOLOGIES
    • ASP.NET MVC Charts
    • JSP Charts
    • PHP Charts
    • Python Charts
    • Spring MVC Charts

Angular Pie Charts & Doughnut Charts

Download Angular Chart Samples
  • Angular Chart Samples
  • JavaScript Chart Samples
  • React Chart Samples
  • Vue.js Chart Samples
  • jQuery Chart Samples
  • PHP Chart Samples
  • Python Django Chart Samples
  • ASP.NET Chart Samples
  • JSP Chart Samples
  • Spring MVC Chart Samples
  • Dashboard Samples
  • JavaScript StockChart Samples

Angular Pie Chart divides a circle into multiple slices that are proportional to their contribution towards the total sum. Pie Chart is also referred to as Circular Chart. Angular Doughnut Charts are similar to pie charts except for a hollow center. On clicking on each slice, it either explodes / implodes based on it's current state.

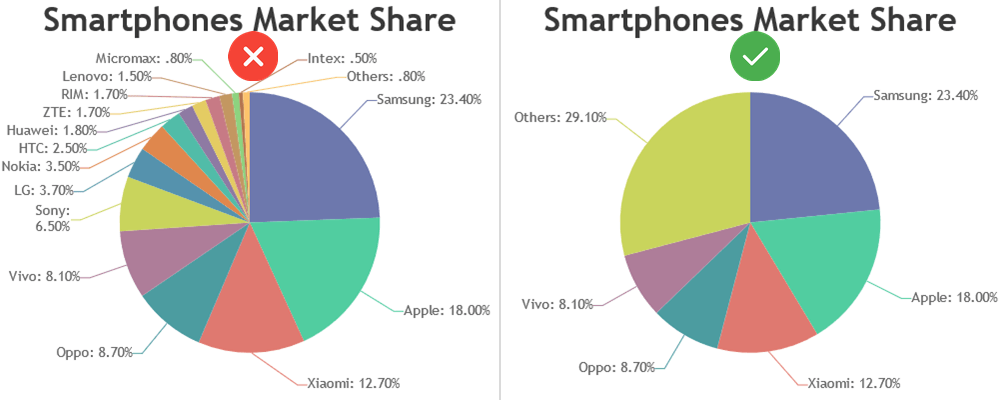
Annotation (index / data label) is a great feature to be used in case of Pie / Doughnut chart. Library automatically adjusts the position of index labels so that it can show more labels without overlapping.

Angular Pie Charts

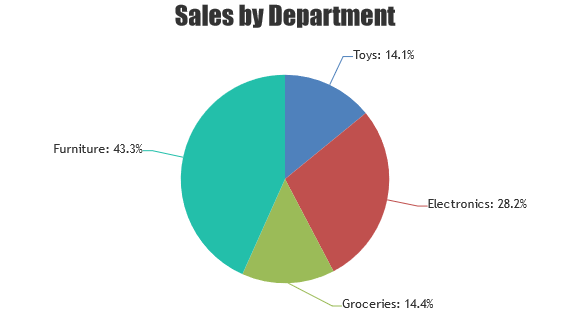
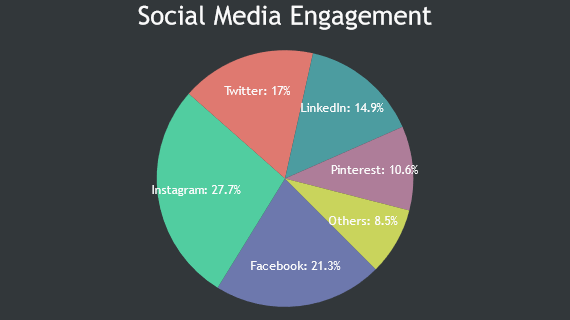
Pie Chart is a circular chart divided into sectors, each sector is proportional to the quantity it represents.

Angular Pie Chart with Index Labels
Pie Chart with Index Labels
Angular Pie Chart in Dark Theme
Pie Chart in Dark Theme

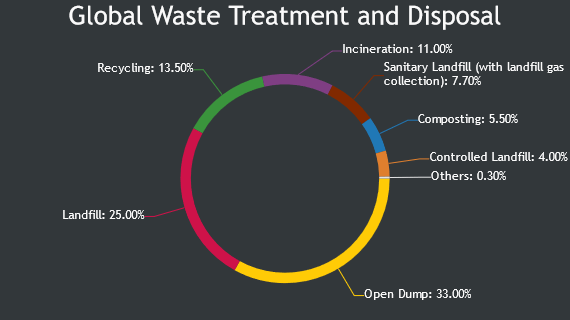
Angular Doughnut / Donut Charts

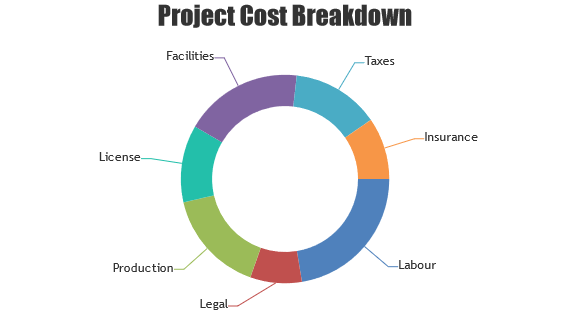
Doughnut Chart is a circular chart with a hollow center.

Angular Doughnut / Donut Chart with Index Labels
Doughnut Chart with Index Labels
Angular Doughnut / Donut Chart in Dark Theme
Doughnut Chart in Dark Theme

Features used Commonly in Angular Pie & Doughnut Charts

Most commonly used features in Angular Pie & Doughnut Charts include startAngle, radius, innerRadius, exploded, indexLabel, etc.

  • You can rotate the pie / doughnut chart by setting startAngle. Rotate it clockwise by increasing the angle & anticlockwise by decreasing the angle.
  • Size of the pie / doughnut can be controlled by setting radius property.
  • In case of doughnut chart, the inner radius can be changed by setting innerRadius property.
  • Slice of pie / doughnut chart can be exploded during the initial chart render by setting exploded property.
  • You can show indexlabel for every datapoint by setting indexLabel property in dataseries level.

Angular Pie & Doughnut Chart Types

  • Angular Pie Chart
  • Angular Doughnut Chart

General Tips for Angular Pie & Doughnut Charts

  • Use annotations (index / data labels).
  • Sorting datapoints by value can make it much easier to understand the chart.
  • Limit the number of slices by merging smaller categories. Pie / Doughnut charts with a large number of slices can be difficult to read.
© fenopix
  • About Us
  • FAQs
  • Careers
  • Privacy Policy
Server Side Technologies
  • ASP.NET MVC Charts
  • PHP Charts
  • JSP Charts
  • Spring MVC Charts
Front End Technologies
  • JavaScript Charts
  • jQuery Charts
  • React Charts
  • Angular Charts
  • JavaScript StockCharts
Contact
  • Fenopix, Inc.
  • 2093 Philadelphia Pike,
  • #5678, Claymont,
  • Delaware 19703
  • United States Of America