Login to Ask a Question or Reply
Forum Replies Created by Indranil
-
December 26, 2018 at 5:35 pm in reply to: multiple charts with dynamic id using angularjs ng-repeat #23859
Thanks for the information. We are looking into your query and will get back to you at the earliest.
____________
Indranil Deo,
Team CanvasJSDecember 25, 2018 at 2:38 am in reply to: Waterfall Chart – reduce size of starting and finish column #23849Can you please provide a pictorial representation of your requirement so that we can understand it better and help you out? Also, can you please brief me what do you mean ‘reduce the size of the starting and finishing column’?
____________
Indranil Deo,
Team CanvasJSDecember 25, 2018 at 2:38 am in reply to: multiple charts with dynamic id using angularjs ng-repeat #23848Can you please confirm if it is AngularJS/Angular 2+ being used by you.
____________
Indranil Deo,
Team CanvasJSYou are setting the zoomEnabled property at dataSeries level. Instead, setting it at the chart options level will work fine in your case. Please take a look at this updated jsfiddle.
____________
Indranil Deo,
Team CanvasJSYou can add a padding/border to the DIV(container) then capture the image of the DIV(container) using html2canvas library and export the image. Please take a look at this jsfiddle.
____________
Indranil Deo,
Team CanvasJSAnita,
Thanks for choosing CanvasJS.
You can download the commercial version of CanvasJS from the My Account page.
After downloading the commercial version, please replace the CanvasJS Trial Version source file in your application with the Commercial Version and make sure to clear the browser cache.
__
Indranil Deo
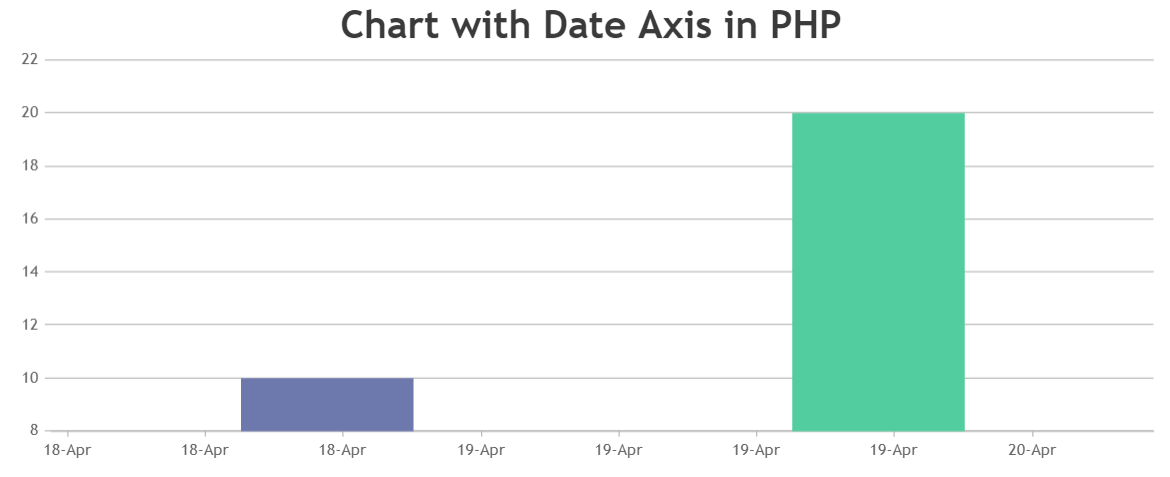
Team CanvasJSTo display the chart containing datetime value in PHP, you need to first convert datetime string to PHP timestamp using strtotime(). Later convert PHP timestamp value to javascript timestamp and assign that value to dataPoint x-value along with the corresponding y-value in the following format –
$dataPoints[] = array("x" => (strtotime($row[0])*1000), "y" => $row[1]);Then convert the array ‘$dataPoints’ into JSON representation using json_encode(). Also, set the `xValueType: “dateTime”` as timestamp values are getting assigned to the chart instead of Date objects as shown below –
xValueType: "dateTime",
dataPoints:  <?php echo json_encode($dataPoints, JSON_NUMERIC_CHECK) ?>
Kindly download the sample PHP project from this link.
The above sample shows how to pass dateTime from a database into Charts in PHP. A ReadMe file has been included for your convenience with all the instructions to set up the project.
___________
Indranil Deo
Team CanvasJSPlease check this MDN link to know more about instantiating javascript objects. Also, please take a look at this jsfiddle to render chart inside bootstrap tabs.
___________
Indranil Deo,
Team CanvasJSApril 25, 2018 at 10:14 am in reply to: How can i get access to a canvasJS chart through a DOM-Container #20454Since you are using the jQuery selector
var c = $("#chartContainer").CanvasJSChart();, please use the jQuery plugin (https://cdn.canvasjs.com/jquery.canvasjs.min.js) instead of Javascript.___________
Indranil Deo,
Team CanvasJSScenario 1 would not cause any performance issue. But in Scenario 2 as the chart is getting recreated every time it may cause performance lag due to the browser memory management. Also please refer this blog-post on tips to improve performance.
___________
Indranil Deo,
Team CanvasJSDebbie,
After going through your code it seems like you have not instantiated the chart Object. Instantiating the chart Object before rendering it should work fine in your case. Please take a look at this documentation page for further information.
___________
Indranil Deo,
Team CanvasJSCan you please create a jsfiddle reproducing the issue so that we can look into the code and help you out.
___________
Indranil Deo,
Team CanvasJS