@d77info,
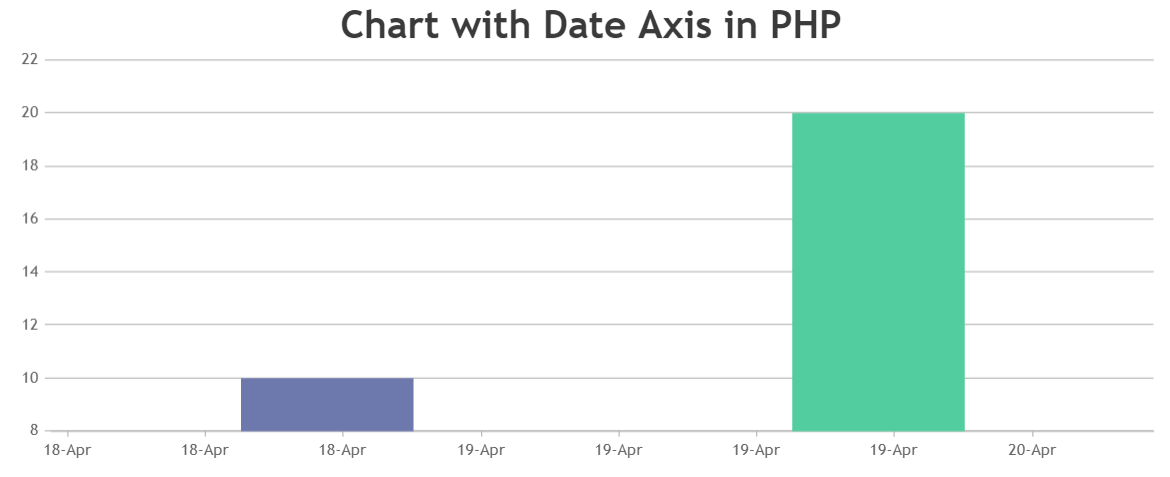
To display the chart containing datetime value in PHP, you need to first convert datetime string to PHP timestamp using strtotime(). Later convert PHP timestamp value to javascript timestamp and assign that value to dataPoint x-value along with the corresponding y-value in the following format –
$dataPoints[] = array("x" => (strtotime($row[0])*1000), "y" => $row[1]);
Then convert the array ‘$dataPoints’ into JSON representation using json_encode(). Also, set the `xValueType: “dateTime”` as timestamp values are getting assigned to the chart instead of Date objects as shown below –
xValueType: "dateTime",
dataPoints:  <?php echo json_encode($dataPoints, JSON_NUMERIC_CHECK) ?>
Kindly download the sample PHP project from this link.
The above sample shows how to pass dateTime from a database into Charts in PHP. A ReadMe file has been included for your convenience with all the instructions to set up the project.

___________
Indranil Deo
Team CanvasJS
