Login to Ask a Question or Reply
Forum Replies Created by Indranil
-
As of now, markers can have only five possible values – “circle”, “square”, “triangle”, “cross” & “none”. However, you can position images in place of markers to display your custom markers. Please take a look at this jsfiddle.
However, it is much easier to achieve it by editing just a few lines of the source code. You will have to first purchase a commercial license to get access to the source code. Please contact us once you have completed the purchase and we will be happy to help you with this easy method.
____________
Indranil Deo,
Team CanvasJSJanuary 4, 2019 at 10:42 pm in reply to: multiple charts with dynamic id using angularjs ng-repeat #23928Thanks for sharing the code sample. We are looking into it and will revert back to you with an appropriate solution at the earliest.
____________
Indranil Deo,
Team CanvasJSTejal,
You can overcome this issue by defining the myMethod(e) outside the window.onload event handler. Please take a look at this updated jsfiddle.
___________
Indranil Deo,
Team CanvasJSPlease take a look at this improved version of the previous example with toolTip formatted to show the actual Y value.
___________
Indranil Deo,
Team CanvasJSYou can use the title option to display text inside the doughnut chart. Setting the verticalAlign property to center and the dockInsidePlotArea to true will display the title at the center of the doughnut.
Please take a look at this jsfiddle.
___________
Indranil Deo,
Team CanvasJSYou can achieve the above requirement by setting the legendText for each dataPoint and the showInLegend property to true. Please take a look at this jsfiddle.
__________
Indrail Deo,
Team CanvasJSI checked the provided jsfiddle it seems you have made a typo, instead of fonrFamily it will be fontFamily. Please take a look at this updated jsfiddle.
__________
Indrail Deo,
Team CanvasJSCanvasJS uses “Impact” as a default font-family for the title, which is only available as bold. Setting the fontFamily of the title to a different font style and the
fontWeight: "lighter"should work fine in your case.__________
Indrail Deo,
Team CanvasJSYou can add special characters to legends by adding Unicode escape sequences in string literals like
legendText: "\u00DF e". Please take a look at this JSFiddle for an example on adding unicode to legend text.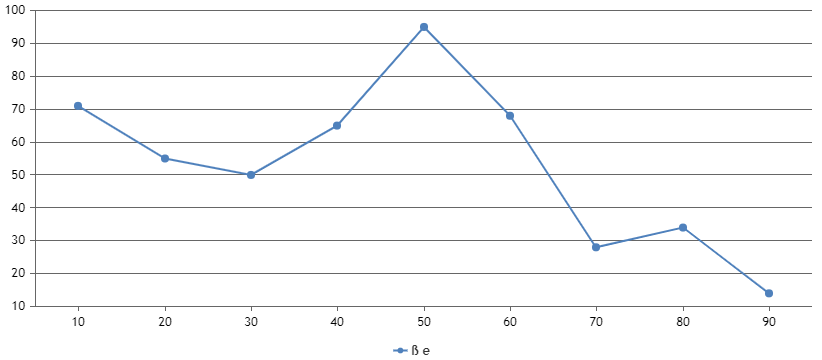
Also, you can refer to this Wikipedia page for a list of Unicode.
__________
Indrail Deo
Team CanvasJSThe CanvasJS npm package listed is not an official release but from a third party. We currently have plans for building and publishing npm package but no definite timeline yet.
__________
Indrail Deo,
Team CanvasJSCan you please check your project with the latest version of CanvasJS. In case it doesn’t help can you please create a sample project and share it over Google-Drive or Onedrive so that we can look into your code understand the issue and help you out.
____________
Indranil Deo,
Team CanvasJSDecember 27, 2018 at 7:46 pm in reply to: multiple charts with dynamic id using angularjs ng-repeat #23869To create multiple charts with dynamic id, you can use ngRepeat to iterate through an array containing the chartContainer id, then use the obtained id values to create multiple chartContainer as shown below –
HTML
<div ng-controller="chartContainerController">
   <chart-Container ng-repeat="chartContainer in chartContainers" chart-container-data="chartContainer" />
 </div>
JS
angular.module('myapp', [])
  .controller('chartContainerController', ['$scope', function($scope) {
    $scope.chartContainers = [
      { id: 'chartContainer1' },
      { id: 'chartContainer2' },
      { id: 'chartContainer3' },
      { id: 'chartContainer4' }];
  }])
  .directive('chartContainer', function() {
  return {
    restrict: 'E', // Element directive
    scope: { chartContainer: '=chartContainerData' },
    template: '<div id = {{chartContainer.id}} style="height: 360px; width: 100%;"></div>'
  };
});
Please take a look at this JSFiddle for a complete working code.
____________
Indranil Deo,
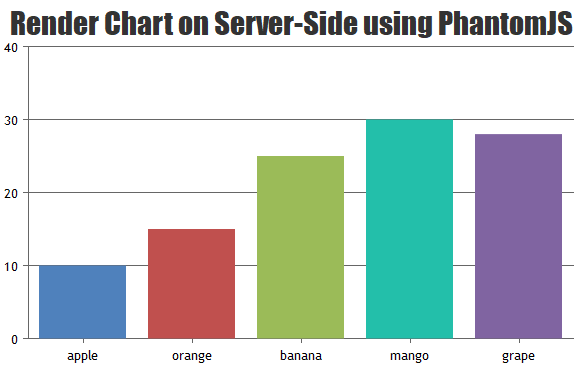
Team CanvasJSFor security reasons, modern email providers have disabled Javascript for incoming emails. Hence, it is not possible to integrate CanvasJS Charts directly in an email.
However, you can render the chart on server-side using a headless browser like PhantomJS, then captures the chart image from a web page, save it to a particular location and use the same within your email template.
Below is the sample code to render a chart using PhantomJS and save it as an image –
"use strict";
var page = require('webpage').create();
page.viewportSize = { width: 600, height : 600 };
page.content = '<html><body>HELLO<div id="chartContainer" style="height: 370px; width: 100%;"></div></body></html>';
var now = new Date();
if(page.injectJs('./canvasjs.min.js')){ //inject the CanvasJS file. Set the file path accordingly
  page.evaluate(function(fs) {
    var chart = new CanvasJS.Chart("chartContainer", {
      animationEnabled: false,
      title:{
        text: "Basic Column Chart"
      },
      data: [
        {
          type: "column", //change chart type to 'pie', 'line', 'area', etc
          dataPoints: [
            { label: "apple",  y: 10  },
            { label: "orange", y: 15  },
            { label: "banana", y: 25  },
            { label: "mango",  y: 30  },
            { label: "grape",  y: 28  }
          ]
        }
      ]
    });
    chart.render();
  });
}

//Use clipRect if only a part of page has to be captured
var clipRect = page.evaluate(function() {
  return document.getElementById("chartContainer").getBoundingClientRect();
});

//Comment below line to render entire page
page.clipRect = {
  top : clipRect.top,
  left : clipRect.left,
  width : clipRect.width,
  height : clipRect.height
};

console.log(now);
page.render("BasicColumnChart"+" " +now.getHours()+"h "+now.getMinutes()+"m "+now.getSeconds()+"s "+".png"); //This line captures required parts of the page, comment this line to capture the entire page.
//Here, the image is stored in the same directory as of Phantom Project. Specify the required location to save the image Ex: D:/charts/BasicColumnChart.png

phantom.exit(0);
Please download the sample project from this forum thread for a working example.
___________
Indranil Deo
Team CanvasJSTejal,
Sorry as of now it is not possible to access the title/chart options through the canvas container id. Instead, you can use the following code snippets
chart.title.textto access the title text through the chart object. Please take a look at this updated jsfiddle.____________
Indranil Deo,
Team CanvasJS