Login to Ask a Question or Reply
Forum Replies Created by Indranil
-
Are you looking for something like this? In case you are looking for something else, could you please send us a pictorial representation of the requirements so that we can understand it better and help you out.
__________
Indranil Deo,
Team CanvasJS-
This reply was modified 8 years, 2 months ago by
Indranil.
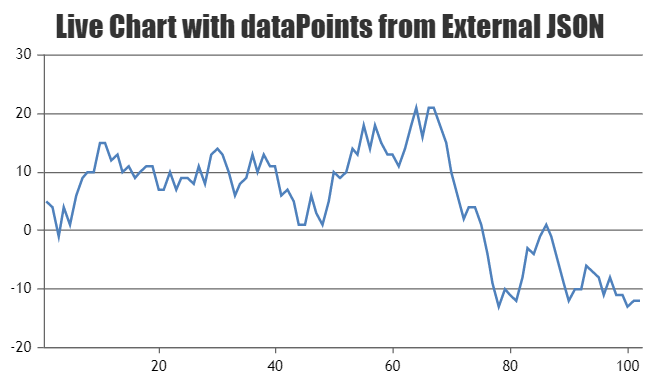
Please check this sample project to create dynamic charts using data from MySQL database in PHP. Also, please refer to this documentation page to create a Live Updating Charts from JSON API & AJAX.
___________
Indranil Deo,
Team CanvasJSDebbie,
You can use scroll() to trigger a function that would get the position of an individual chart and then render the chart when it comes to the view. Please take a look at this updated code.
___________
Indranil Deo,
Team CanvasJSDebbie,
Rendering the chart when you scroll down to the next view should work fine in your case. If it doesn’t suit your requirement can you please create a sample project with your sample code and share it over (google drive / one drive) so that we can understand your requirement better and help you out.
___________
Indranil Deo,
Team CanvasJSDebbie,
You can use animation property to set animation while rendering the Chart(same can be done for multiple charts). Please take a look at this jsfiddle.
___________
Indranil Deo,
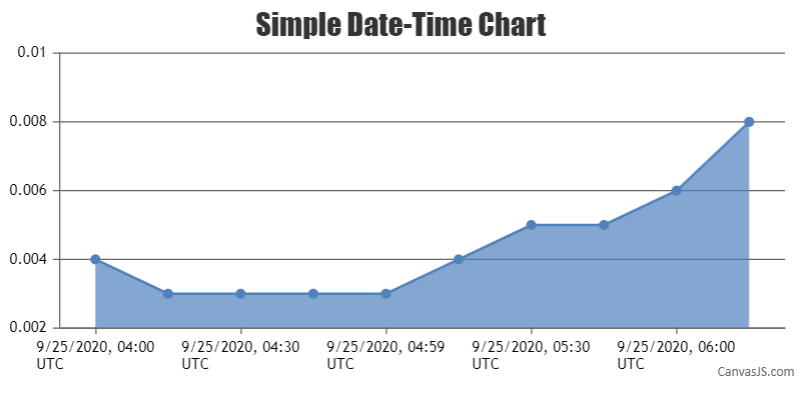
Team CanvasJSX-values can either be number or valid date-time object. In your case, its not valid date-object. Changing
x: date[i],tox: new Date(date[i]),and passing date-time in one of the valid formats should work fine in this case.Also, please take a look at this documentation page for information on rendering chart with date-time axis.
Still, if you are facing any issue or have other requirements please create a jsfiddle reproducing the issue you are facing so that we can understand your requirement better and help you out.
___________
Indranil Deo
Team CanvasJSChart is rendered based on the sequence of datapoints given. If
{x:5,y:7}is given first then{x:4,y:5}, it renders x:5 and then x:4. To avoid such issues, you can sort dataPoints before rendering the chart. Please take a look at this jsfiddle.___________
Indranil Deo,
Team CanvasJSApril 16, 2018 at 10:15 am in reply to: Is it possible that i can move Index Labels left or right? #20330Sorry, it’s not possible to move indexlabel towards left/right. However, you can move it inside/outside the column using indexLabelPlacement.
___________
Indranil Deo,
Team CanvasJSCan you please provide your sample data so that we can look into the data and help you out.
___________
Indranil Deo,
Team CanvasJSSetting the interval to 1 along with intervalType to “day” should work fine in your case.
___________
Indranil Deo,
Team CanvasJSCan you please create a sample project reproducing the issue that you are facing and share it(over onedrive or google-drive) so that we can understand your code and scenario better and help you out?
___________
Indranil Deo,
Team CanvasJSAre you looking for something like this? If not please try to provide a pictorial representation of your requirement so that we can understand your requirement better and help you out.
__________
Indranil Deo,
Team CanvasJS -
This reply was modified 8 years, 2 months ago by