Login to Ask a Question or Reply
You must be logged in to post your query.
Home › Forums › Chart Support › multiple charts with dynamic id using angularjs ng-repeat
multiple charts with dynamic id using angularjs ng-repeat
- This topic has 11 replies, 2 voices, and was last updated 7 years, 6 months ago by
Indranil.
-
December 24, 2018 at 5:38 pm #23841
hi,
how can i solve this multiple charts with dynamic id using angularjs ng-repeat, can anyone guide me guys
thank you
December 25, 2018 at 2:38 am #23848Can you please confirm if it is AngularJS/Angular 2+ being used by you.
____________
Indranil Deo,
Team CanvasJSDecember 25, 2018 at 3:51 pm #23851its angularjs
December 26, 2018 at 5:35 pm #23859Thanks for the information. We are looking into your query and will get back to you at the earliest.
____________
Indranil Deo,
Team CanvasJSDecember 27, 2018 at 7:46 pm #23869To create multiple charts with dynamic id, you can use ngRepeat to iterate through an array containing the chartContainer id, then use the obtained id values to create multiple chartContainer as shown below –
HTML
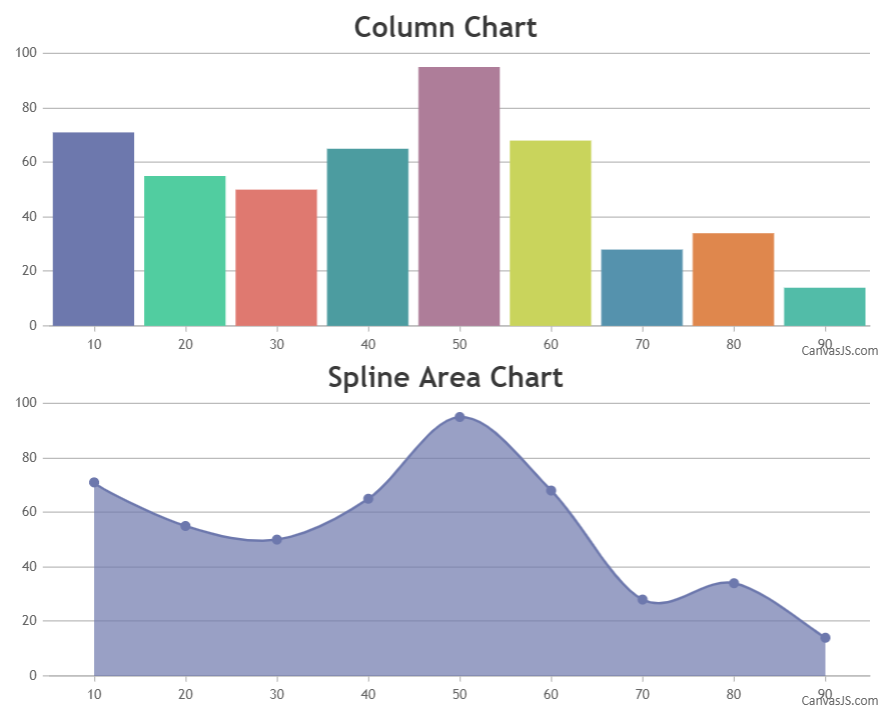
<div ng-controller="chartContainerController">
   <chart-Container ng-repeat="chartContainer in chartContainers" chart-container-data="chartContainer" />
 </div>
JS
angular.module('myapp', [])
  .controller('chartContainerController', ['$scope', function($scope) {
    $scope.chartContainers = [
      { id: 'chartContainer1' },
      { id: 'chartContainer2' },
      { id: 'chartContainer3' },
      { id: 'chartContainer4' }];
  }])
  .directive('chartContainer', function() {
  return {
    restrict: 'E', // Element directive
    scope: { chartContainer: '=chartContainerData' },
    template: '<div id = {{chartContainer.id}} style="height: 360px; width: 100%;"></div>'
  };
});
Please take a look at this JSFiddle for a complete working code.
____________
Indranil Deo,
Team CanvasJSJanuary 3, 2019 at 9:56 pm #23916Hi,
Thanks for this answer and with window.onload function its working fine but I need this after click submit button it means without window.onload function it should display with the click function can u please guide me how to achive thisJanuary 4, 2019 at 11:24 am #23919January 4, 2019 at 10:42 pm #23928Thanks for sharing the code sample. We are looking into it and will revert back to you with an appropriate solution at the earliest.
____________
Indranil Deo,
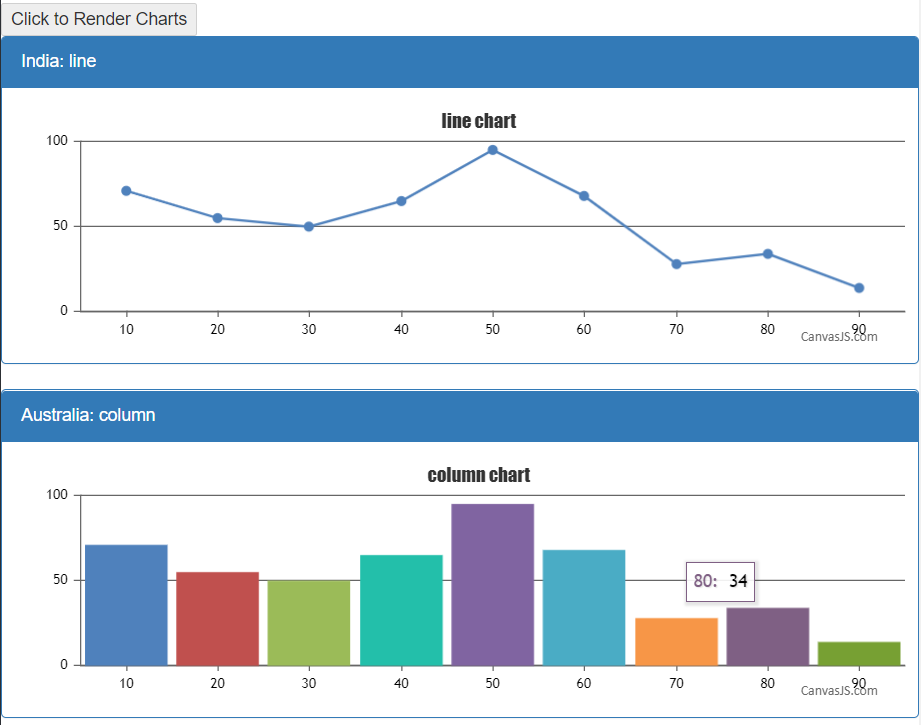
Team CanvasJSJanuary 8, 2019 at 8:45 pm #23955You can use directive to add the required HTML elements and use the same as a container(DIV) for the charts to render on button click. Please check the below code snippet –
HTML
<div ng-controller="chartContainerController">
   <div>
     <button id="renderChart" ng-click="clickMe()">Click to Render Charts</button>
     <div add-containers id="addContainers"></div>
   </div>
</div>
JS
angular.module('myapp', [])
  .controller('chartContainerController', ['$scope', function($scope) {
    $scope.chartContainers = [
      { id: 'chartContainer1', type: 'line', country: 'India' },
      { id: 'chartContainer2', type: 'column', country: 'Australia' },
      { id: 'chartContainer3', type: 'spline', country: 'Canada' },
      { id: 'chartContainer4', type: 'scatter', country: 'USA' }];
  }])
  .directive("addContainers", function($compile){
  return{
    scope:false,
    link:function(scope,element,attributes){
      scope.clickMe= function() {
        $.when(
          angular.element(document.getElementById('addContainers')).append($compile(('<div class="panel panel-primary" ng-repeat="chartContainer in chartContainers"> <div class="panel-heading">{{ chartContainer.country }}: {{chartContainer.type}} </div><div class="panel-body"><div id="{{ chartContainer.id }}" class="container"></div></div></div>'))(scope))).then(function() {
          angular.forEach(scope.chartContainers, function (value, index) {
            var chart = new CanvasJS.Chart(scope.chartContainers[index].id, {
              title: {
                text: scope.chartContainers[index].type +" chart"
              },
              data: [
                {
                  type: scope.chartContainers[index].type,
                  dataPoints: [
                    { x: 10, y: 71 },
                    { x: 20, y: 55 },
                    { x: 30, y: 50 },
                    { x: 40, y: 65 },
                    { x: 50, y: 95 },
                    { x: 60, y: 68 },
                    { x: 70, y: 28 },
                    { x: 80, y: 34 },
                    { x: 90, y: 14 }
                  ]
                }
              ]
            });
            chart.render();
          });
          document.getElementById("renderChart").disabled = true;
        }
      )};
    }
  }
});
Also, kindly take a look at this JSFiddle to render chart on button click in AngularJS.
___________
Indranil Deo
Team CanvasJSJanuary 9, 2019 at 12:13 pm #23969January 9, 2019 at 6:19 pm #23972hi,
its working fine, how to print this all charts together and i had given ‘chart.print();’ but its coming one by one
thank you
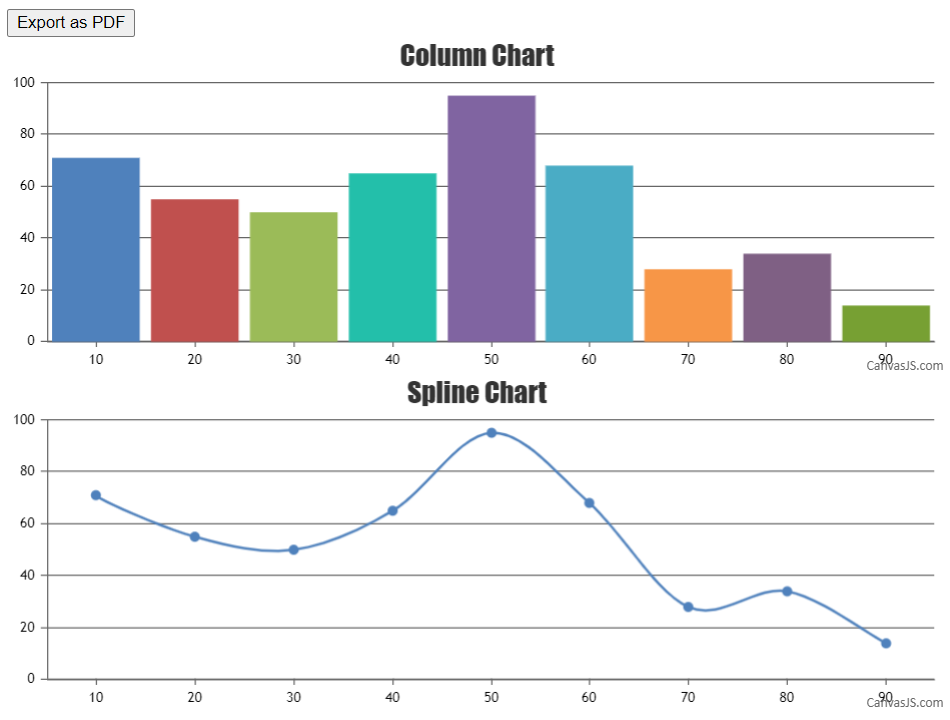
January 10, 2019 at 8:24 pm #23982chart.print() is only available for the specific chart on which it is called. You can call chart.print() on individual charts separately or you can use a third party plugin html2canvas to capture a combined image of the available charts and print it using window.print(). Please refer the below code –
$("#exportButton").click(function(){
  html2canvas(document.querySelector("#chartsContainer")).then(canvas => {
    var dataURL = canvas.toDataURL();
    var pdf = new jsPDF();
    pdf.addImage(dataURL, 'JPEG', 20, 20, 170, 120); //addImage(image, format, x-coordinate, y-coordinate, width, height)
    pdf.save("CanvasJS Charts.pdf");
  });
});
Also, kindly check this JSFiddle to combine multiple charts using html2canvas.
___________
Indranil Deo
Team CanvasJS
You must be logged in to reply to this topic.