Home Forums Chart Support How to Add Custom Markers?

How to Add Custom Markers?

Viewing 6 posts - 1 through 6 (of 6 total)
  • #23937

    i want some custom markers to represent my data! is it possible?
    is there any paid services or plugin with custom markers?

    #23939

    @shri,

    As of now, markers can have only five possible values – “circle”, “square”, “triangle”, “cross” & “none”. However, you can position images in place of markers to display your custom markers. Please take a look at this jsfiddle.

    However, it is much easier to achieve it by editing just a few lines of the source code. You will have to first purchase a commercial license to get access to the source code. Please contact us once you have completed the purchase and we will be happy to help you with this easy method.

    ____________
    Indranil Deo,
    Team CanvasJS

    #37359

    Hi,
    I have a paid commercial license for CanvasJS. Could you please tell me where in the source code to look to add a custom marker?

    Thanks

    #37383

    Adam Pallozzi,

    Thanks for being a valuable customer of CanvasJS.

    Please follow the below steps to add custom marker to CanvasJS Chart.
    1. Add marker drawing logic in the end of drawMarker method of canvasjs.js (Source-Code) downloaded from My Account page.

    else if(markerType === "customMarkerType") { 
        //marker drawing logic
    }

    2. Define the newly added markerType in dataseries

    data: [{
        .
        .
        markerType: "customMarkerType"
        .
    }]

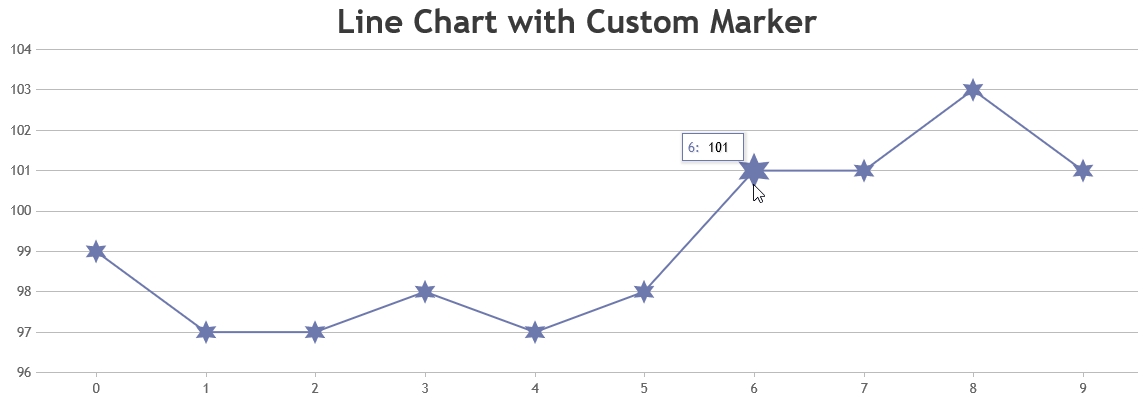
    Below code-snippet will help you in adding star as marker-type to CanvasJS Chart.

    //Add the below lines at the end of drawMarker method
    else if (markerType === "star") {
        var points = 6;
        ctx.strokeStyle = markerColor;
    
        ctx.beginPath();
        ctx.moveTo(x, y + markerSize);
        for (var i = 0; i < 2 * points + 1; i++) {
            var r = (i % 2 == 0) ? markerSize : markerSize / 2;
            var a = Math.PI * i / points;
            ctx.lineTo(x + r * Math.sin(a), y + r * Math.cos(a));
        };
        ctx.closePath();
    
        if (markerColor)
            ctx.fill();
    }
    
    //Define marker-type in chart-options
    data: [{
        ...
        markerType: "star",
    }]

    JavaScript Line Chart with Custom Marker


    Vishwas R
    Team CanvasJS

    #37384

    Thanks for the details Vishwas.

    I assume every time I update CanvasJS I will lose my changes?

    Would you guys consider making a plugin system where we could register a module like that as a plugin so we don’t need to recreate it on each update?

    #37495

    Adam Pallozzi,

    I assume every time I update CanvasJS I will lose my changes?

    Yes, you will have to update your source-code on every product release / update.

    Would you guys consider making a plugin system where we could register a module like that as a plugin so we don’t need to recreate it on each update?

    Thanks for the suggestion. We will reconsider this suggestion for our future releases.


    Vishwas R
    Team CanvasJS

Viewing 6 posts - 1 through 6 (of 6 total)

You must be logged in to reply to this topic.