Login to Ask a Question or Reply
You must be logged in to post your query.
Home › Forums › Feature Requests & Feedback › Save image automatically on server end
Save image automatically on server end
- This topic has 6 replies, 5 voices, and was last updated 5 years, 10 months ago by
Manoj Mohan.
Tagged: your code not working
-
June 28, 2018 at 4:32 pm #21327
I want to save image on server end so that i can use it in my email.
June 29, 2018 at 8:04 pm #21339In order to render chart on the server side you would require a headless browser like PhantomJS. Here is an article which might help.
Please take a look at this sample PhantomJS project, that captures the chart image from web page and saves it to a particular location. Please refer to instructions.txt file for clear understanding.
__
Priyanka M S
Team CanvasJSMay 23, 2019 at 3:45 pm #25274I have used your code to generate your image which you gave as an example. Its not working at all.
Following is my code:“use strict”;
var page = require(‘webpage’).create();;
page.viewportSize = { width: 600, height : 600 };
page.content = ‘<html><body><div id=”chartContainer” style=”height: 370px; width: 100%;”></div></body></html>’;
var now = new Date();
if(page.injectJs(‘/Downloads/canvasjs-2.3.1/jquery.canvasjs.min.js’)){ //inject the CanvasJS file. Set the file path accordinglypage.evaluate(function(fs) {
var chart = new CanvasJS.Chart(“chartContainer”, {
animationEnabled: false,
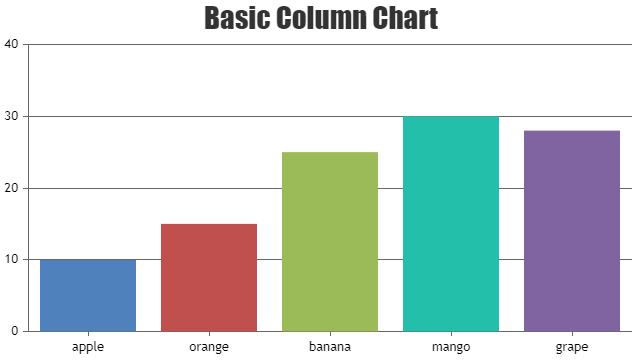
title:{
text: “Basic Column Chart”
},
data: [
{
type: “Column”,
dataPoints: [
{ label: “apple”, y: 10 },
{ label: “orange”, y: 15 },
{ label: “banana”, y: 25 },
{ label: “mango”, y: 30 },
{ label: “grape”, y: 28 }
]
}
]
});
chart.render();
chart.exportChart({format: “png”});
});
}//Use clipRect if only a part of page has to be captured
var clipRect = page.evaluate(function() {
return document.getElementById(“chartContainer”).getBoundingClientRect();
});page.clipRect = {
top : clipRect.top,
left : clipRect.left,
width : clipRect.width,
height : clipRect.height
};//page.render(); //uncomment this line to render the entire web page.
console.log(now);
page.render(“BasicColumnChart”+” ” +now.getHours()+”h “+now.getMinutes()+”m “+now.getSeconds()+”s “+”.jpg”); //This line captures required parts of the page, comment this line to capture the entire page.
//Here, the image is stored in the same directory as of Phantom Project. Specify the required location to save the image Ex: D:/charts/BasicColumnChart.pngphantom.exit(0);
May 24, 2019 at 3:50 pm #25284You are passing
Columnas chart-type in the code shared above which is not a valid chart-type. Changing chart-type fromColumntocolumnshould work fine in your case. Please take a look at this updated sample.Please refer to this documentation page for more information about chart-types available in CanvasJS.
—–
Manoj Mohan
Team CanvasJSAugust 23, 2020 at 2:28 pm #30725Hi. The website I’m trying to create charts to email is a shared linux server which doesn’t have phantomjs or any headless browser software installed. Is there any other way (preferably in php) to achieve this?
August 24, 2020 at 7:05 pm #30803CanvasJS is a javascript library that runs on the client-side(in browser). To save an image on server side, you need to run CanvasJS library on a headless browser. Please refer to this Stack Overflow thread to know more about running headless browser in shared hosting.
—-
Manoj Mohan
Team CanvasJS
Tagged: your code not working
You must be logged in to reply to this topic.