@rahultanwar,
For security reasons, modern email providers have disabled Javascript for incoming emails. Hence, it is not possible to integrate CanvasJS Charts directly in an email.
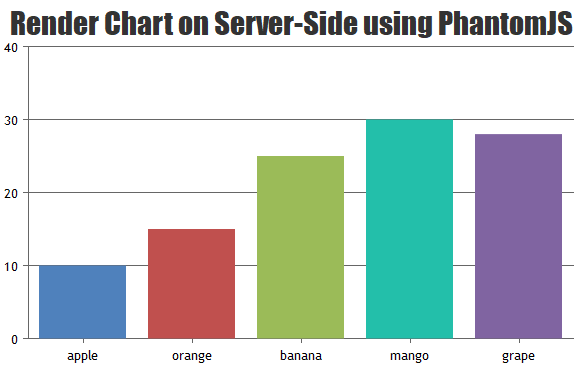
However, you can render the chart on server-side using a headless browser like PhantomJS, then captures the chart image from a web page, save it to a particular location and use the same within your email template.
Below is the sample code to render a chart using PhantomJS and save it as an image –
"use strict";
var page = require('webpage').create();
page.viewportSize = { width: 600, height : 600 };
page.content = '<html><body>HELLO<div id="chartContainer" style="height: 370px; width: 100%;"></div></body></html>';
var now = new Date();
if(page.injectJs('./canvasjs.min.js')){ //inject the CanvasJS file. Set the file path accordingly
  page.evaluate(function(fs) {
    var chart = new CanvasJS.Chart("chartContainer", {
      animationEnabled: false,
      title:{
        text: "Basic Column Chart"
      },
      data: [
        {
          type: "column", //change chart type to 'pie', 'line', 'area', etc
          dataPoints: [
            { label: "apple",  y: 10  },
            { label: "orange", y: 15  },
            { label: "banana", y: 25  },
            { label: "mango",  y: 30  },
            { label: "grape",  y: 28  }
          ]
        }
      ]
    });
    chart.render();
  });
}

//Use clipRect if only a part of page has to be captured
var clipRect = page.evaluate(function() {
  return document.getElementById("chartContainer").getBoundingClientRect();
});

//Comment below line to render entire page
page.clipRect = {
  top : clipRect.top,
  left : clipRect.left,
  width : clipRect.width,
  height : clipRect.height
};

console.log(now);
page.render("BasicColumnChart"+" " +now.getHours()+"h "+now.getMinutes()+"m "+now.getSeconds()+"s "+".png"); //This line captures required parts of the page, comment this line to capture the entire page.
//Here, the image is stored in the same directory as of Phantom Project. Specify the required location to save the image Ex: D:/charts/BasicColumnChart.png

phantom.exit(0);
Please download the sample project from this forum thread for a working example.
___________
Indranil Deo
Team CanvasJS
.