Login to Ask a Question or Reply
Forum Replies Created by Indranil
-
January 22, 2019 at 6:50 pm in reply to: Cannot set a string array to x-axis in a responsive chart #24066
Thanks for the solution. We will fix this issue in our next release.
___________
Indranil Deo,
Team CanvasJSJanuary 21, 2019 at 6:46 pm in reply to: Cannot set a string array to x-axis in a responsive chart #24055You can achieve the above requirement by passing dataPoint x-value as Date Object and the corresponding y-value as numeric. Please take a look at this documentation page to render a chart with Date & Time axis.
___________
Indranil Deo,
Team CanvasJSWe will fix this issue in our next release. For time being please declare the variable i within the for loop as shown here
( var i = 0; i < allDOMEventHandlers.length; i++ ).Please refer to this forum post for more information.
___________
Indranil Deo,
Team CanvasJSSorry, controlling the first label on the Axes is not available as of now.
___________
Indranil Deo,
Team CanvasJSCan you kindly share a sample project with sample JSON data over google-drive or onedrive so that we can understand it better and help you out?
___________
Indranil Deo,
Team CanvasJSJanuary 14, 2019 at 8:31 pm in reply to: Waterfall Chart – reduce size of starting and finish column #24022Setting the includeZero to false should work fine in your case. In case it doesn’t suit your requirement kindly create a jsfiddle reproducing the issue so that we can look into the code, understand your requirement better and help you out.
___________
Indranil Deo,
Team CanvasJSGlad you were able to resolve the issue. Thanks for choosing CanvasJS.. :)
___________
Indranil Deo,
Team CanvasJSThe commercial version of CanvasJS doesn’t carry any watermark or credit link. Since you have already replaced the trial version of CanvasJS with the commercial version, please clear the browser cache and try again.
___________
Indranil Deo,
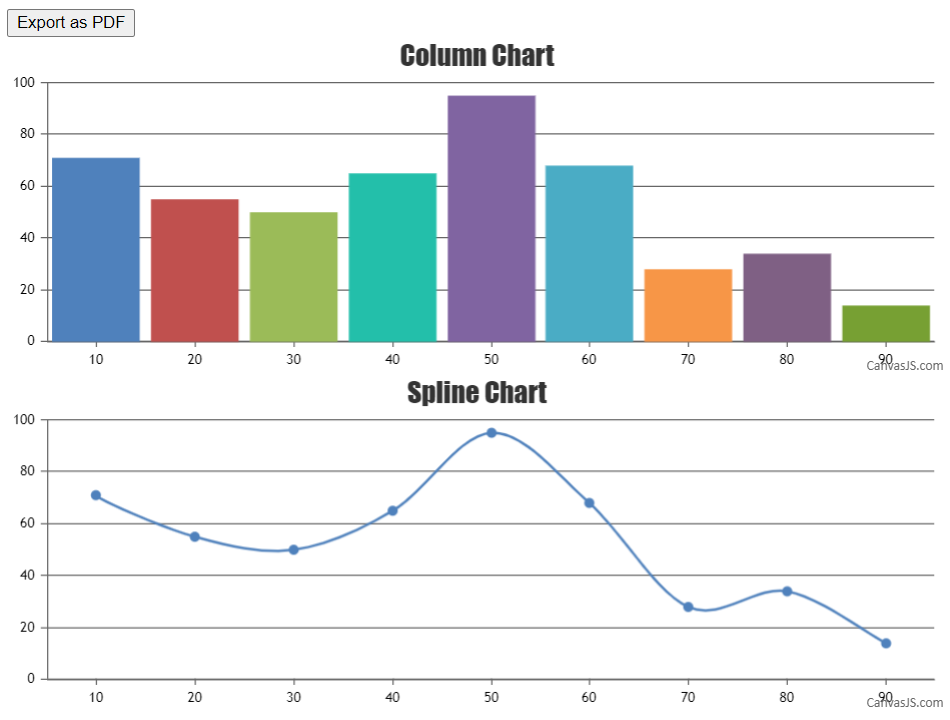
Team CanvasJSJanuary 10, 2019 at 8:24 pm in reply to: multiple charts with dynamic id using angularjs ng-repeat #23982chart.print() is only available for the specific chart on which it is called. You can call chart.print() on individual charts separately or you can use a third party plugin html2canvas to capture a combined image of the available charts and print it using window.print(). Please refer the below code –
$("#exportButton").click(function(){
  html2canvas(document.querySelector("#chartsContainer")).then(canvas => {
    var dataURL = canvas.toDataURL();
    var pdf = new jsPDF();
    pdf.addImage(dataURL, 'JPEG', 20, 20, 170, 120); //addImage(image, format, x-coordinate, y-coordinate, width, height)
    pdf.save("CanvasJS Charts.pdf");
  });
});
Also, kindly check this JSFiddle to combine multiple charts using html2canvas.
___________
Indranil Deo
Team CanvasJSPlease take a look at this jsfiddle. The dataSeries under the chart type “stepArea” are used for plotting the Stacked Step Area Chart.
___________
Indranil Deo,
Team CanvasJSJanuary 9, 2019 at 2:36 am in reply to: Getting error while integrating pie chart in angularjs code #23966Can you kindly create a sample project with sample dataPoints and share it over Google-Drive or Onedrive, so that we can look into your code, understand the issue properly and help you out?
____________
Indranil Deo,
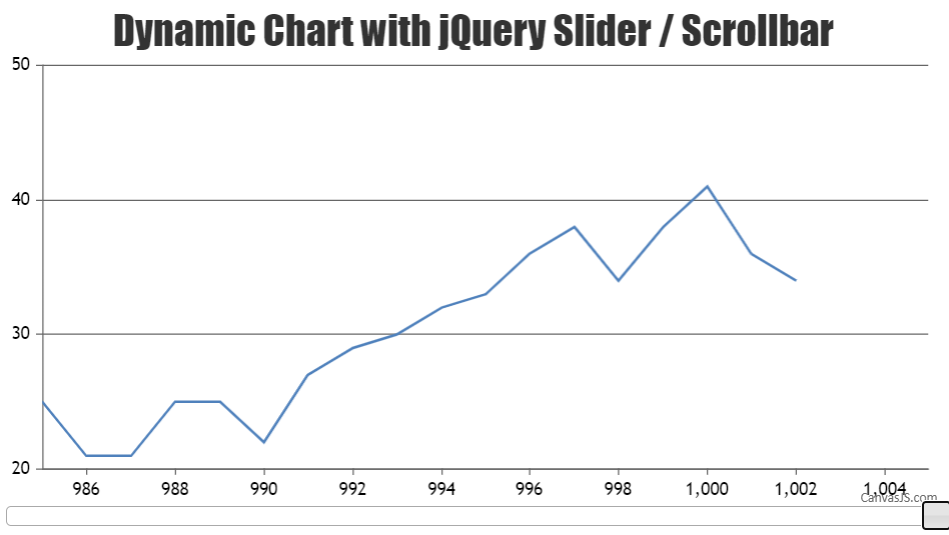
Team CanvasJSJanuary 9, 2019 at 2:25 am in reply to: Dynamic multiline chart graph with scrollbar at x axis #23965You can use jQuery ScrollBar to add scrolling functionality to the chart. To sync the ScrollBar with the axis you need to update the axis viewport with the ScrollBar value as shown in the code snippet below –
chart.options.axisX.viewportMinimum = $(".scroll-bar").slider("option", "value");
chart.options.axisX.viewportMaximum = chart.options.axisX.viewportMinimum + viewportSize;
Please take a look at this JSFiddle to add ScrollBar on X Axis with dynamic data.
___________
Indranil Deo
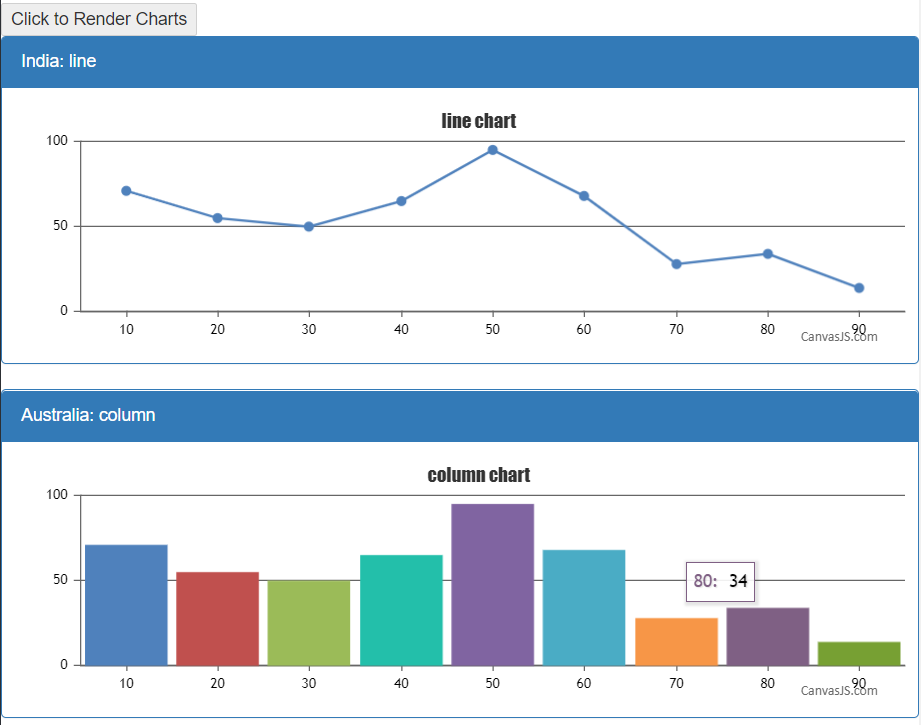
Team CanvasJSJanuary 8, 2019 at 8:45 pm in reply to: multiple charts with dynamic id using angularjs ng-repeat #23955You can use directive to add the required HTML elements and use the same as a container(DIV) for the charts to render on button click. Please check the below code snippet –
HTML
<div ng-controller="chartContainerController">
   <div>
     <button id="renderChart" ng-click="clickMe()">Click to Render Charts</button>
     <div add-containers id="addContainers"></div>
   </div>
</div>
JS
angular.module('myapp', [])
  .controller('chartContainerController', ['$scope', function($scope) {
    $scope.chartContainers = [
      { id: 'chartContainer1', type: 'line', country: 'India' },
      { id: 'chartContainer2', type: 'column', country: 'Australia' },
      { id: 'chartContainer3', type: 'spline', country: 'Canada' },
      { id: 'chartContainer4', type: 'scatter', country: 'USA' }];
  }])
  .directive("addContainers", function($compile){
  return{
    scope:false,
    link:function(scope,element,attributes){
      scope.clickMe= function() {
        $.when(
          angular.element(document.getElementById('addContainers')).append($compile(('<div class="panel panel-primary" ng-repeat="chartContainer in chartContainers"> <div class="panel-heading">{{ chartContainer.country }}: {{chartContainer.type}} </div><div class="panel-body"><div id="{{ chartContainer.id }}" class="container"></div></div></div>'))(scope))).then(function() {
          angular.forEach(scope.chartContainers, function (value, index) {
            var chart = new CanvasJS.Chart(scope.chartContainers[index].id, {
              title: {
                text: scope.chartContainers[index].type +" chart"
              },
              data: [
                {
                  type: scope.chartContainers[index].type,
                  dataPoints: [
                    { x: 10, y: 71 },
                    { x: 20, y: 55 },
                    { x: 30, y: 50 },
                    { x: 40, y: 65 },
                    { x: 50, y: 95 },
                    { x: 60, y: 68 },
                    { x: 70, y: 28 },
                    { x: 80, y: 34 },
                    { x: 90, y: 14 }
                  ]
                }
              ]
            });
            chart.render();
          });
          document.getElementById("renderChart").disabled = true;
        }
      )};
    }
  }
});
Also, kindly take a look at this JSFiddle to render chart on button click in AngularJS.
___________
Indranil Deo
Team CanvasJS