Login to Ask a Question or Reply
Forum Replies Created by Adithya Menon
-
The zooming behavior is designed such that zooming is limited upto a certain region, so that user doesn’t end up zooming into a blank-region (region with no dataPoints). To zoom in to a certain region, there should be a minimum of 3-4 dataPoints over the axis.
—
Adithya Menon
Team CanvasJSMaik,
You can change valueFormatString on rangeChanging event to change the format of axis labels based on zoom level. Please find the code snippet below,
function customValueFormatter(e) {
  var hours=1000*60*60;
  if(!e.chart.options.axisX)
    e.chart.options.axisX = {};

  if(e.trigger === "reset") {
    e.chart.options.axisX.valueFormatString  = null;
  }
  else if(e.trigger === "zoom") {
    //Hour (Comparing Hours)
    if((((e.axisX.viewportMaximum -  e.axisX.viewportMinimum)/(hours))<1)) {
      e.chart.options.axisX.valueFormatString = null;
    }
    //Day (Comparing Days)
    else if(((e.axisX.viewportMaximum -  e.axisX.viewportMinimum)/(hours*24))<7) {
      e.chart.options.axisX.valueFormatString = "HH:mm";
    }
    //Year (Comparing Years)
    else if(((e.axisX.viewportMaximum -  e.axisX.viewportMinimum)/(hours*24*30*30))< 12) {
      e.chart.options.axisX.valueFormatString = "D-MMM-YYYY";
    }
    else{
      e.chart.options.axisX.valueFormatString = null;
    }
  }
}
Kindly take a look at this JSFiddle for an example on the same.
—
Adithya Menon
Team CanvasJSCan you kindly upload a working sample project to Google Drive or Onedrive and share it with us along with a sample database so that we can run it locally to understand the scenario better and help you out?
—
Adithya Menon
Team CanvasJSJuly 4, 2022 at 7:02 pm in reply to: Multiseries (multi-lines) chart from multiples JSON files #38366Creating a multi-series chart with data from 2 JSON files seems to be working fine. You can take a look at this code-snippet for an example where the JSON data is fetched,
$.getJSON("https://canvasjs.com/data/docs/btcusd2018.json", function(data1) {
  for( var i = 0; i < data1.length; i++) {
    dataPoints1.push({ x: new Date(data1[i].date), y: data1[i].open });
  }
  chart.render();
});

$.getJSON("https://canvasjs.com/data/docs/btcusd2018.json", function(data2) {
  for( var i = 0; i < data2.length; i++) {
    dataPoints2.push({ x: new Date(data2[i].date), y: data2[i].close });
  }
  chart.render();
})
Kindly refer to this updated JSFiddle for an example on the same.
If you are still facing any issues, kindly create a sample project (PHP project) along with a sample JSON reproducing the issue and share it with us over Google-Drive or Onedrive so that we can run it locally to understand the scenario better and help you out.
—
Adithya Menon
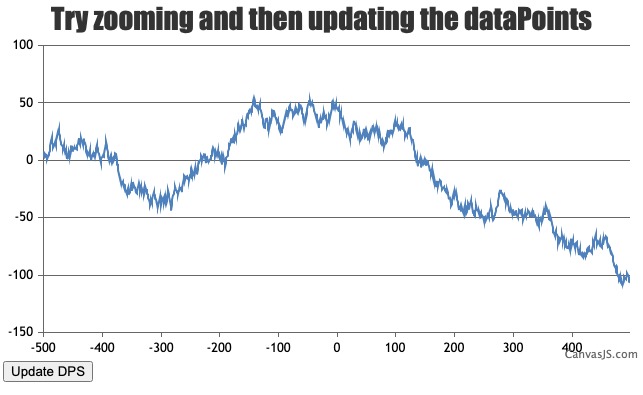
Team CanvasJSWhenever you zoom or pan into a region and then update the dataPoints, it still retains the viewport region and it seems to work as intended. Kindly take a look at this JSFiddle for an example on the same.
If you are still facing an issue, can you kindly create JSFiddle reproducing the issue you are facing & share it with us so that we can look into the code / chart-options being used, understand the scenario better and help you resolve?
—
Adithya Menon
Team CanvasJSJune 20, 2022 at 6:47 pm in reply to: Panning/scrolling sometimes stays active even without clicking/dragging #38144Can you please brief us further on the issue that you are facing and provide the steps to reproduce it so that we can run it locally at our end to understand the use case and help you resolve it?
—
Adithya Menon
Team CanvasJSJune 9, 2022 at 6:35 pm in reply to: over lay doesn’t hide whenever exploded is false from true #38038You can use the hightlightEnabled property to enable or disable highlighting of dataPoints on mouse hover.
If this doesn’t solve your issue, can you kindly upload the image to imgur and share it with us so that we can understand your scenario better and help you out? (The image shared above seems to be broken)
—
Adithya Menon
Team CanvasJSWe are looking into your query and will get back to you at the earliest.
__
Adithya Menon
Team CanvasJSThank you for your suggestion. We will revisit this behavior in future releases.
—
Adithya Menon
Team CanvasJSCan you kindly create a complete sample project reproducing the issue you are facing and share it with us over Google-Drive or Onedrive along with sample data so that we can look into your code, run it locally at our end to understand the scenario better, and help you out?
From what we have observed, sometimes things get delayed mostly when we are not able to reproduce the issue at our end or not able to understand the exact requirements or due to the variation in chart-options being used by you and us. Because of these reasons we expect you to share the complete sample project along with sample data(dummy data) which helps us run it locally at our end to understand the use case and help you resolve it.
—
Adithya Menon
Team CanvasJSClicking the reset button of an individual chart will reset the axis range to its previous state just before rendering the stockchart. In your case, you are calling stockchart.render() within rangeChanged event. Once the reset button is clicked, it gets the axis range values from viewportMinimum & viewportMaximum just before calling render, i.e. updated values from the slider.
—
Adithya Menon
Team CanvasJSThis small error might be due to the margin property not being set for all the charts. Setting the margin property for all the charts seems to be working in this case. The bounds of the chart can be accessed via get method or dot notation.
Kindly take a look at this updated JSFiddle for an example on the same.
—
Adithya Menon
Team CanvasJSIt is possible to align both the primary and the secondary Y-axis. Aligning the y-axis for multiple charts can be achieved by setting the margin property. The margin value has to be calculated based on the bounds of the primary and secondary y-axis as shown in the code below –
function alignYAxes(charts) {
  var axisYBound = 0, axisY2Bound = 0, axisYChartIndex = 0, axisY2ChartIndex = 0;
  for(var i = 0; i < charts.length; i++) {
    if(charts[i].axisY[0].bounds.x2 > axisYBound) {
      axisYBound = charts[i].axisY[0].bounds.x2;
      axisYChartIndex = i;
    }

    if(charts[i].axisY2[0].bounds.x1 > axisY2Bound) {
      axisY2Bound = charts[i].axisY[0].bounds.x2;
      axisY2ChartIndex = i;
    }
  }

  for(var i = 0; i < charts.length; i++) {
    if(axisYChartIndex !== i)
      charts[i].axisY[0].set("margin", charts[axisYChartIndex].axisY[0].bounds.x2 - (charts[i].axisY[0].bounds.x2 - charts[i].axisY[0].bounds.x1));

    if(axisY2ChartIndex !== i)
      charts[i].axisY2[0].set("margin", charts[axisY2ChartIndex].width - (charts[axisY2ChartIndex].axisY2[0].bounds.x1 - (charts[i].axisY2[0].bounds.x1 - charts[i].axisY2[0].bounds.x2)));
  }
}
Also, kindly take a look at this JSFiddle with the code to align both the primary and secondary y-axis for multiple charts.
—
Adithya Menon
Team CanvasJSIt is possible to create a dynamic table with the data from a dynamic chart as per your requirement. Kindly take a look at the code snippet below,
$("#chartData tr:first-child").append("<td>" + (color == "red" ? "" : "<span class='blue'>"+yVal+"</span>") +"</td>")
 $("#chartData tr:nth-child(2)").append("<td>"+ (color == "red" ? "<span class='red'>"+yVal+"</span>" : "") +"</td>")
Please take a look at this updated JSFiddle for an example on the same.
—
Adithya Menon
Team CanvasJSConsidering this thread as duplicate of Tabular presentation of graph data and hence closing the same.
—-
Adithya Menon
Team CanvasJS