Login to Ask a Question or Reply
Forum Replies Created by Adithya Menon
-
We have just added CanvasJS React Chart & StockChart packages to NPM registry. Now, you can add our React chart & stockchart packages to your React application via NPM. Please refer to the release blog for more information. Please check out our NPM package and let us know your feedback.
—
Adithya Menon,
Team CanvasJSRagu nathan,
We just recently released the non-commercial / evaluation version over NPM and we are currently considering a bunch of options for our commercial users. But we have not decided on it yet. We will get in touch with you as soon as we have a solution in place. Thanks for your patience.
—
Adithya Menon
Team CanvasJSIn line charts, markers are automatically disabled when there are large number of datapoints. However, if you still like to show markers, you can set markerSize property to a value greater than zero.
—
Adithya Menon
Team CanvasJSWe are limiting the zooming & panning to have a minimum of 3-4 datapoints across x-axis in case of xy zooming type. This behaviour is designed to help users not zoom into blank regions (region with no dataPoints).
___________
Adithya Menon,
Team CanvasJSWe are limiting the zooming & panning to have a minimum of 3-4 datapoints across x-axis in case of xy zooming type. This behaviour is designed to help users not zoom into blank regions (region with no dataPoints).
___________
Adithya Menon,
Team CanvasJSApril 12, 2023 at 6:25 pm in reply to: Getting tooltip shown for area chart in case of multiple chart #42481It is not possible to show the tooltip for the filled region as of now.
—
Adithya Menon
Team CanvasJSThank you for reporting the use-case. This warning message appears to be specific to Firefox and is not currently appearing on other browsers such as Chrome, Edge, etc. Rest assured; we will be looking into this in the future versions.
—
Adithya Menon
Team CanvasJSChart animates only on the first render, as of now. Due to which, the type of animation that you are looking is not available as an in-built feature, currently.
—
Adithya Menon
Team CanvasJSApril 10, 2023 at 6:14 pm in reply to: Getting tooltip shown for area chart in case of multiple chart #42461Tooltip will be shown only when you move mouse over the line & the data points and will not be shown for the filled region as of now.
If you are facing some other issue, kindly create JSFiddle reproducing the issue you are facing and share it with us so that we can look into the chart-options being used, understand the scenario and help you with a better solution.
—
Adithya Menon
Team CanvasJSIt is not possible to place an image on each slice of the pie chart as of now.
—
Adithya Menon
Team CanvasJSMarch 7, 2023 at 6:37 pm in reply to: ‘Toggle tooltip’ button is not adopting to the High Contrast themes. #42317This query does not seem to be related to CanvasJS Charts. Feel free to let us know if you have any queries related to CanvasJS Charts,
—
Adithya Menon
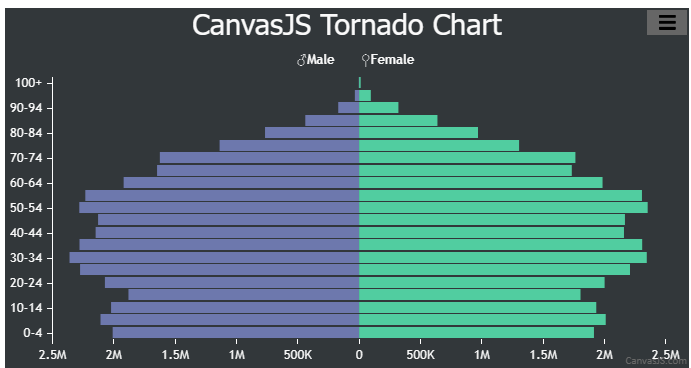
Team CanvasJSIt is possible to create a tornado chart using Stacked Bar chart. Kindly take a look at this JSFiddle for an example on tornado chart with complete code.
—
Adithya Menon
Team CanvasJSKindly create a sample project reproducing the issue & share it with us over Google-Drive or Onedrive so that we can run the sample locally to understand the scenario better and help you out.
From what we have observed, sometimes things get delayed mostly when we are not able to reproduce the issue or not able to understand the exact scenario, or the solution that we provide may not work properly due to the variation in chart options being used by you and us.
Having a sample project helps us in figuring out the issue and suggesting an appropriate solution accordingly.
—
Adithya Menon
Team CanvasJSPassing stripline label property while parsing the JSON received from the service seems to be working fine. Please check out the code snippet below for the same,
stripLines: [{
    thickness: 2,
    color: "#555555",
    label: "Today: " + jsonData.stripLineLabel[0],
    labelFontColor: "#a8a8a8"
}]
If you are still facing issue, kindly create a sample project reproducing the issue you are facing and share it with us over Google-Drive or Onedrive along with sample data so that we can look into your code, run it locally at our end to understand the scenario better and help you out.
—-
Adithya Menon
Team CanvasJSYou can use striplines on the X-axis to add a vertical line to your chart. To customise the color of this line, you can use the color property.
—
Adithya Menon
Team CanvasJS