• Demos
    • JavaScript Charts
    • JavaScript StockCharts
  • Download/NPM
    • Download CanvasJS
    • Install via NPM
  • Integrations
    Front End Technology Samples
    • React Charts
    • Angular Charts
    • Vue.js Charts New!
    • jQuery Charts
    • Dashboards
    Server Side Technology Samples
    • PHP Charts
    • Python Charts New!
    • ASP.NET MVC Charts
    • Spring MVC Charts
    • JSP Charts
  • License
  • Blog
  • Docs
    • Chart Documentation
    • StockChart Documentation
  • Support Forum
    • Chart Support
    • StockChart Support
  • My Account
My Account
  • KEY FEATURES
    • Chart with Index / Data Label
    • Chart with Zooming & Panning
    • Multi Series Chart
    • Chart with Multiple Axes
    • Combination Charts
    • Chart with Animation
    • Chart with Logarithmic Axis
    • Dynamic Chart
    • Chart with Data from AJAX
    • Drilldown Chart
    • Responsive Chart
    • Synchronized Charts
  • LINE CHARTS
    • Line Chart with Date-Time Axis
    • Dashed Line Chart
    • Multi Series Line Chart
    • Spline Chart
    • Multi Series Spline Chart
    • Step Line Chart
    • Multi Series Step Line Chart
  • BAR CHARTS
    • Bar Chart with Category Axis
    • Multi Series Bar Chart
    • Stacked Bar Chart
    • Stacked Bar 100% Chart
    • Stacked Bar 100% Chart with Indexlabels
  • COLUMN CHARTS
    • Column Chart with Numeric Axis
    • Multi Series Column Chart
    • Stacked Column Chart
    • Stacked Column 100% Chart
    • Stacked Column 100% Chart with Indexlabel
    • Waterfall Chart
    • Waterfall Chart with Indexlabels
    • Multi Series Waterfall Chart
  • PIE & DOUGHNUT CHARTS
    • Pie Chart with Index Labels
    • Pie Chart in Dark Theme
    • Doughnut Chart with Index Labels
    • Doughnut Chart in Dark Theme
  • AREA CHARTS
    • Area Chart with Indexlabels
    • Multi Series Area Chart
    • Spline Area Chart
    • Multi Series Spline Area Chart
    • Step Area Chart
    • Stacked Area Chart
    • Stacked Area 100% Chart
  • RANGE CHARTS
    • Range Column Chart
    • Multi Series Range Column Chart
    • Range Bar Chart
    • Multi Series Range Bar Chart
    • Range Area Chart
    • Multi Series Range Area Chart
    • Range Spline Area Chart
    • Multi Series Range Spline Area Chart
  • BUBBLE & SCATTER CHARTS
    • Bubble Chart with Indexlabels
    • Bubble Chart with 3 Dimensional Data
    • Multi Series Scatter Chart
  • FUNNEL & PYRAMID CHARTS
    • Funnel Chart with Index Labels
    • Funnel Chart without Neck
    • Pyramid Chart with Index Labels
  • FINANCIAL CHARTS
    • Candlestick Chart
    • Multi Series Candlestick Chart
    • OHLC Chart
    • OHLC Chart from JSON data
    • Box & Whisker Chart
  • COMBINATION CHARTS
    • Error Bar Chart
    • Pareto Chart
    • Range Area & Line Chart
    • Candlestick & Line Chart
    • OHLC Chart with Trend
  • DYNAMIC CHARTS
    • Dynamic / Live Line Chart
    • Dynamic / Live Column Chart
    • Dynamic / Live Multi Series Chart
  • STOCKCHARTS
    • StockChart with Numeric Axis
    • StockChart with Date-Time Axis
    • StockChart with Navigator & Range Selector
  • JAVASCRIPT, REACT, VUE.JS, JQUERY
    • JavaScript Charts
    • React Charts
    • Vue.js Charts
    • jQuery Charts
  • SERVER SIDE TECHNOLOGIES
    • ASP.NET MVC Charts
    • JSP Charts
    • PHP Charts
    • Python Charts
    • Spring MVC Charts

Angular Dynamic / Live Charts

Download Angular Chart Samples
  • Angular Chart Samples
  • JavaScript Chart Samples
  • React Chart Samples
  • Vue.js Chart Samples
  • jQuery Chart Samples
  • PHP Chart Samples
  • Python Django Chart Samples
  • ASP.NET Chart Samples
  • JSP Chart Samples
  • Spring MVC Chart Samples
  • Dashboard Samples
  • JavaScript StockChart Samples

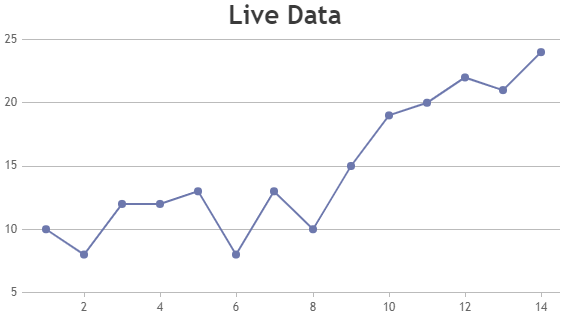
Angular Dynamic Charts are also known as Realtime / Live Chart. Dynamic charts are used when you are showing data that changes with time like stock-price, temperature, etc. All the elements can be updated dynamically across all the chart-types. The data and chart type are the most commonly updated properties in dynamic charts based on certain conditions. Charts are updated instantly & performs faster.

Angular Dynamic Charts

Angular Dynamic Charts are also referred to as Realtime / Live Charts.

Angular Dynamic / Live Line Chart
Dynamic / Live Line Chart
Angular Dynamic / Live Column Chart
Dynamic / Live Column Chart
Angular Dynamic / Live Multi Series Chart
Dynamic / Live Multi Series Chart

Features used Commonly in Angular Dynamic Charts

Most commonly used features in Angular dynamic charts are getters, setters & adding datapoints dynamically.

  • addTo method allows you to add new datapoint to the chart.
  • get method can be used to get the value of any chart property.
  • set method can be used to set / update any property.

General Tips for Angular Dynamic Charts

  • Do not re-create chart each time you have to add a new datapoint. Instead, update the datapoints array & call render() method of chart.
  • If you are adding multiple datapoints using addTo method, make sure to render chart at the end. You can do this by setting updateChart parameter to false for all datapoints except for the last one.

Quick Links

  • Chart Docs
  • StockChart Docs
  • About Us
  • FAQs

Server Side Technologies

  • ASP.NET MVC Charts
  • PHP Charts
  • JSP Charts
  • Spring MVC Charts

Front Side Technologies

  • JavaScript Charts
  • jQuery Charts
  • React Charts
  • Angular Charts
  • JavaScript StockCharts

Contact

  • Fenopix, Inc.
  • 2093 Philadelphia Pike,
  • #5678, Claymont,
  • Delaware 19703
  • United States Of America

©2025 Fenopix Privacy Policy Cookies Policy Careers