Login to Ask a Question or Reply
Forum Replies Created by Thangaraj Raman
-
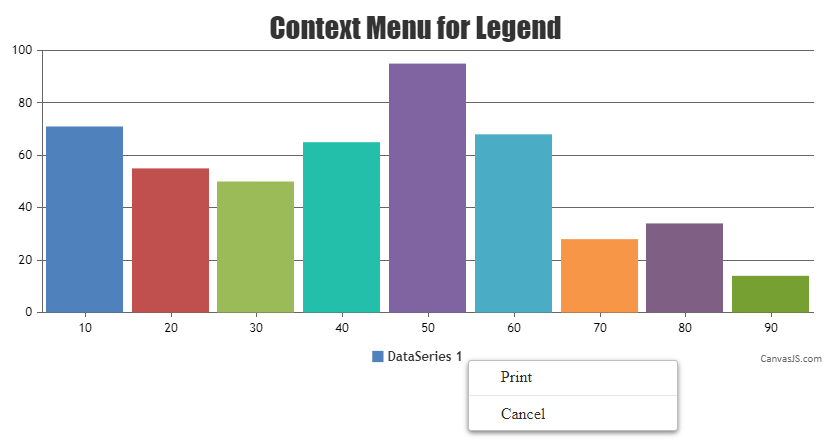
You can show the context menu by checking if the click has occurred in the legend bounds with the help of legend bounds.
Please take a look at this JSFiddle for an example on the same.
—
Thangaraj Raman
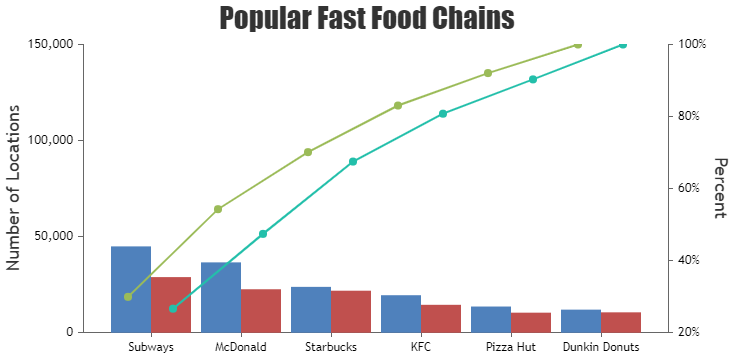
Team CanvasJSYou can add an offset to the x-values in the line chart in order to align them to their respective columns as shown in the code snippet below:
dps1.push({label: chart.data[0].dataPoints[i].label, x: chart.data[0].dataPoints[i].x - 0.25, y: yPercent1});
dps2.push({label: chart.data[0].dataPoints[i].label, x: chart.data[0].dataPoints[i].x + 0.25, y: yPercent2});
Please check this updated StackBlitz for a working example.
—
Thangaraj Raman
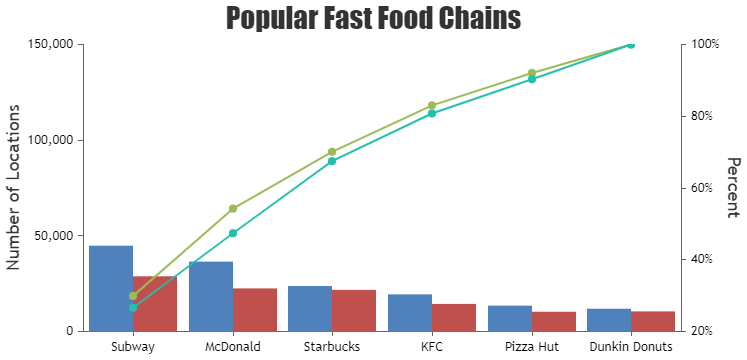
Team CanvasJSYou can add another column dataseries to the chart, and apply the same logic as in the Angular Pareto Chart gallery example to create another line series.
Please take a look at this StackBlitz for a working example.
—
Thangaraj Raman
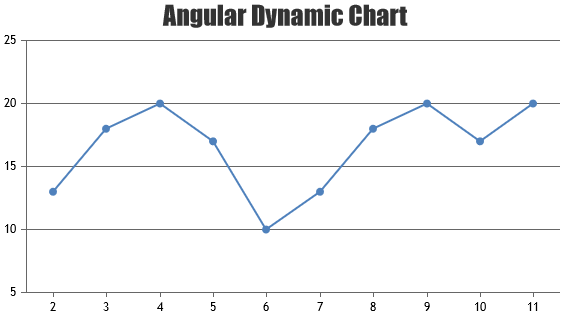
Team CanvasJSPlease take a look at this gallery page for an example of a dynamic chart that updates every 1 second, created in Angular. This example uses random data, however, you can pass sensor data to the chart every 1 second to achieve your requirement.
—
Thangaraj Raman
Team CanvasJSJustine,
Can you kindly create a sample project reproducing the issue and share it with us over Google Drive or OneDrive so that we can look into the code, run it locally to understand the scenario better, and help you out?
—
Thangaraj Raman
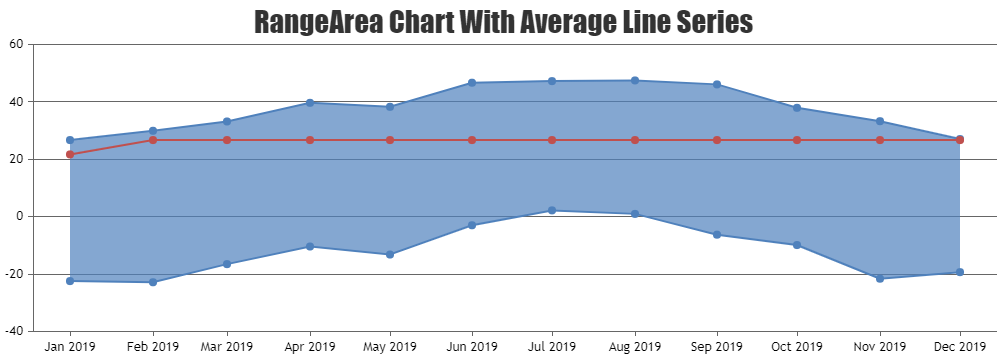
Team CanvasJSYou can parse your data to the format accepted by CanvasJS and create 2 different datapoint arrays for the rangeArea and line dataSeries respectively.
Please check this JSFiddle for a working example.
—
Thangaraj Raman
Team CanvasJSBy default, date-time values are shown in the tooltip, even when the tooltip is shared. You can use xValueFormatString to define the format of the date to be displayed in the tooltip.
—
Thangaraj Raman
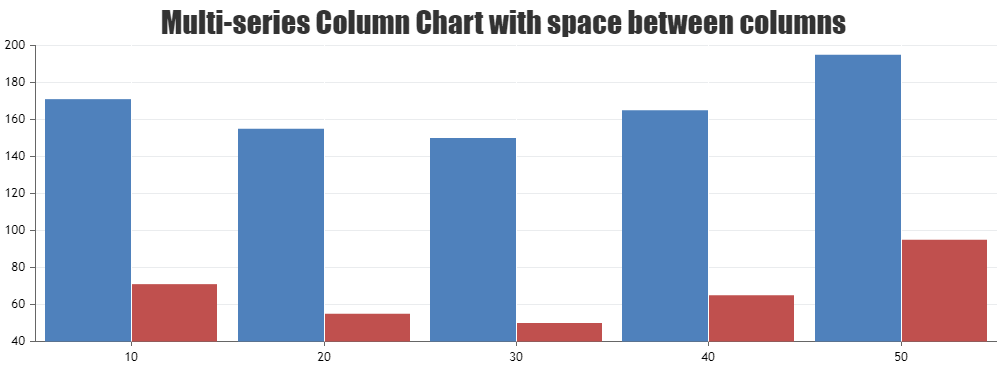
Team CanvasJSOctober 12, 2023 at 6:44 pm in reply to: How to apply spacing between multi column canvasjs charts #43876Adding space between columns in a multi-series column chart is not possible as of now. However, as a workaround, you can use stripLines to achieve the same.
Please check this JSFiddle for a working example.
—
Thangaraj Raman
Team CanvasJS@kmi,
CanvasJS plots the datapoints in the same order that it is passed to the chart, without sorting or grouping. interval and intervalType properties are used to display axis labels at the specified interval and not to group datapoints.
—
Thangaraj Raman
Team CanvasJSSeptember 22, 2023 at 6:36 pm in reply to: Div rows are not aligned with chart horizontal rows #43790Meena,
[UPDATE]
We have just released v3.11.0 with a new feature called indexLabelPadding. Please refer to the release blog for more information. Do download the latest version from our download page and let us know your feedback.
It is not possible to add padding/margin to indexlabels as of now.
—
Thangaraj Raman
Team CanvasJSThe current behavior while zooming is as per design. We will revisit this behavior in our future releases.
—
Thangaraj Raman
Team CanvasJSSeptember 19, 2023 at 5:49 pm in reply to: Div rows are not aligned with chart horizontal rows #43771Meena,
You can make the indexlabel more readable by either increasing the font size of indexLabels by setting indexLabelFontSize property or changing the color of indexLabels by setting indexLabelFontColor.
—
Thangaraj Raman
Team CanvasJSSeptember 15, 2023 at 5:15 pm in reply to: Div rows are not aligned with chart horizontal rows #43755We have updated the sample and it seems to be working fine now. Please use the same link shared earlier, to download the sample project.
—
Thangaraj Raman
Team CanvasJSSeptember 14, 2023 at 6:47 pm in reply to: Div rows are not aligned with chart horizontal rows #43750You can align the table with the chart by setting
box-size: border-boxand updating the chart height accordingly.Please check this updated sample project for a working example.
—
Thangaraj Raman
Team CanvasJS