Login to Ask a Question or Reply
You must be logged in to post your query.
Home › Forums › Chart Support › Div rows are not aligned with chart horizontal rows
Div rows are not aligned with chart horizontal rows
- This topic has 13 replies, 2 voices, and was last updated 2 years, 9 months ago by
mridula.
-
September 1, 2023 at 6:25 pm #43677
Hi Team,
I have a vue component in which i am rendering the chart. It has a section name, section details and the chart. That’s how each row is rendered. I have attached the div content here and please refer the link for the screenshot. The chart horizontal rows are not aligned correctly to the section detail rows on the left. And if you look at the Blood Pressure section it is completely misaligned. can u plz help us in fixing this issue.
template code
<template>
<div>
<div class=”sections-container”>
<div
v-for=”(section, index) in ewsTransformedChartData.sections”
:key=”index”
class=”section-container”
>
<div
:class=”{
‘section-heading’: true,
‘horizontal-heading’: section.sectionDetails.length === 1,
}”
>
{{ section.name }}
</div>
<div v-if=”section.sectionDetails.length > 1″ class=”section-details”>
<div>
<div
v-for=”(detail, detailIndex) in section.sectionDetails”
:key=”detailIndex”
class=”row-with-border”
>
{{ detail.name }}
</div>
</div>
</div>
<div class=”chart-container”>
<div
:id=”‘chartContainer-‘ + index”
:style=”{
height:
section.sectionDetails.length === 1
? ’50px’
: chartContainerHeight(section),
}”
></div>
</div>
</div>
</div>
<div
id=”scroll-container”
ref=”scrollContainer”
style=”
position: fixed;
bottom: 0;
left: 0;
width: 100%;
height: 100px;
overflow: auto;
”
>
<div
id=”scroll-content”
ref=”scrollContent”
:style=”{ width: scrollContentWidth }”
></div>
</div>
</div>
</template>How the chart container height is calculated
chartContainerHeight() {
// Calculate the height based on the number of rows in a section
return (section) => section.sectionDetails.length * 23.1 + “px”;
},style that i have
.row-with-border {
border: 1px solid #ccc;
padding: 1px;
margin-bottom: 0px;
}
.sections-container {
display: flex;
flex-direction: column;
gap: -15px;
width: 95%;
}
.section-container {
position: relative;
margin-bottom: 2px;
font-size: 11px;
display: flex;
align-items: flex-start;
}
.section-heading {
position: absolute;
bottom: 0;
left: 0;
transform-origin: bottom left;
transform: rotate(-90deg) translateX(-100%);
width: 1%;
margin-bottom: 15px;
white-space: nowrap;
}
.horizontal-heading {
width: 15%;
transform: none;
position: relative;
display: inline-block;
margin: 0;
white-space: nowrap;
padding-top: 5px;
height: 70;
}
.section-details {
flex: 1;
max-width: 15%;
overflow: hidden;
padding-top: 10px;
}
.chart-container {
width: 81%;
margin-left: 0px;
padding-top: 0;
margin-top: 0;
}September 4, 2023 at 6:49 pm #43685Changing the height of the chart container(div) should work fine in your case.
If you are still facing issues, kindly create a sample project reproducing the issue and share it with us over Google Drive or OneDrive so that we can look into the code, run it locally to understand the scenario better, and help you out.
—
Thangaraj Raman
Team CanvasJSSeptember 8, 2023 at 9:52 am #43709Hi Thangaraj,
Please find the project here in the below link
https://drive.google.com/drive/folders/1s9wZDJovZFJAoM71i3o3JrnxPC1R1wotPlease find the misalignment issue in the below screenshot.
https://drive.google.com/file/d/1CHOi5Erpq9DO1bB1ZGBB_CMXnID4pW5p/viewThe more you add the section details rows the alignment goes worst.
Can you please give me a solution for this.September 11, 2023 at 6:16 pm #43726As addressed in the previous reply, setting the height of the chart-container based on the height of the table seems to be working fine in this case. In the sample that you have shared, setting the height of 2nd chart to 279px seems to be working fine. Please find the code-snippet below.
#chartContainer-1 {
  height: 279px !important;
}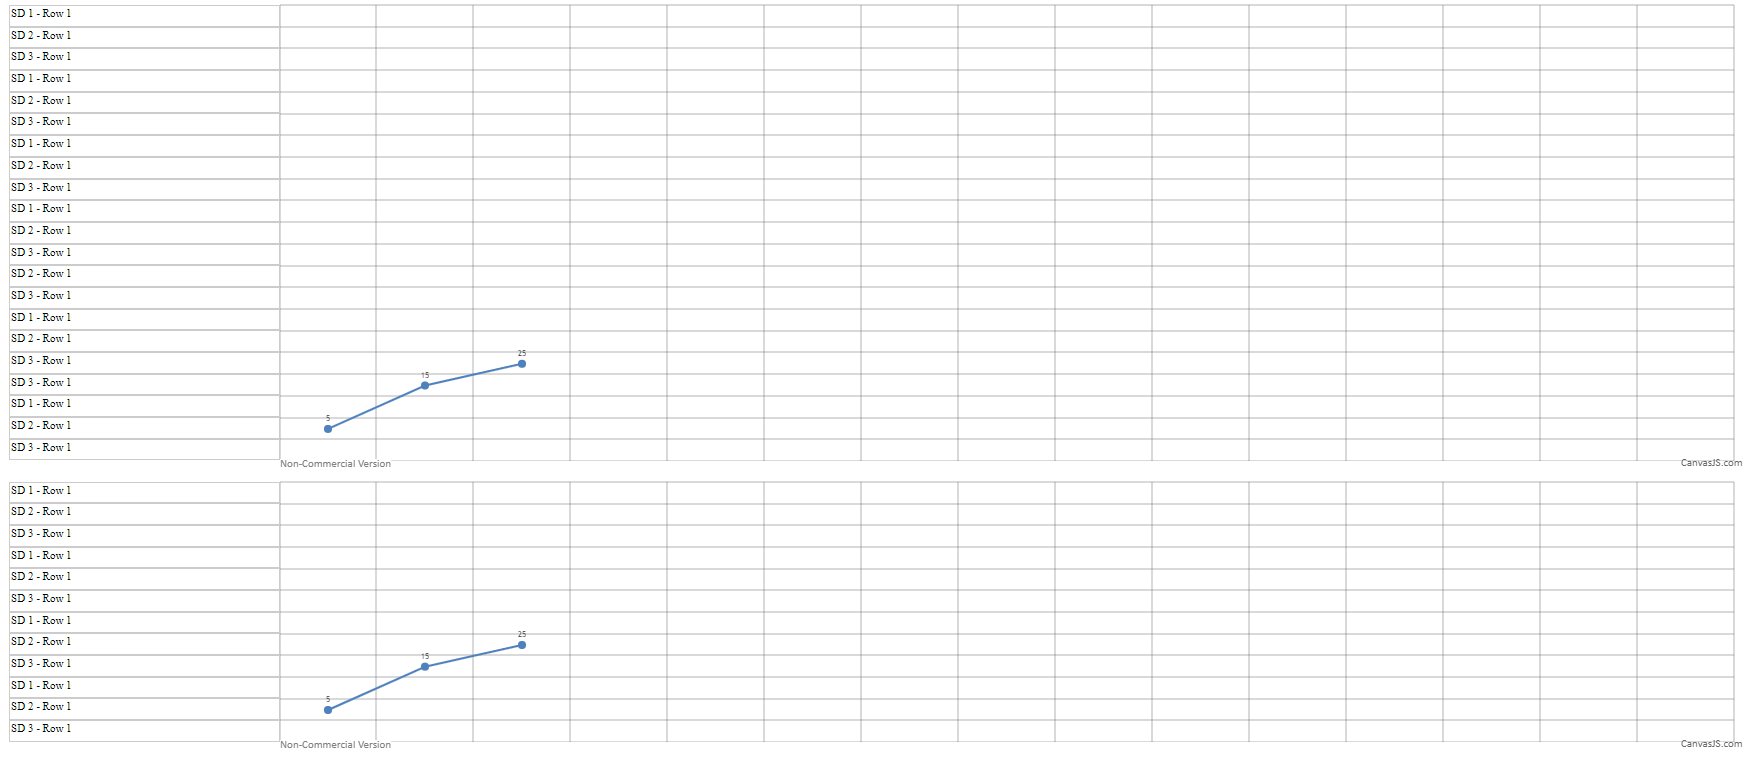
—
Thangaraj Raman
Team CanvasJSSeptember 11, 2023 at 8:23 pm #43729Hi,
Can you make the height dynamic. Based on the number of rows in the left div, the height of the chart should be calculated like the below. I am already calculating and setting the height of the chart. But sometimes, the height of the chart is equal to the section rows. But when u increase/decrease the number of rows, the height is not getting calculated properly. Can you please make this dynamic and see. The issue still exists. Don’t hard code the height. As there will be many charts in the page and the height of each chart should be calculated based upon the number of section rows.
chartContainerHeight() {
return (section) => section.sectionDetails.length * 23.1 + “px”;
}September 14, 2023 at 10:26 am #43730Look at the above screenshot. I gave the below code for the height. But the 2nd section is misaligned again. It should be aligned properly for all the sections in the page.
computed:{
chartContainerHeight() {
return (section) => section.sectionDetails.length * 22.6 + “px”;
}
},As mentioned before, please see what exactly is the issue.
September 14, 2023 at 6:47 pm #43750You can align the table with the chart by setting
box-size: border-boxand updating the chart height accordingly.Please check this updated sample project for a working example.
—
Thangaraj Raman
Team CanvasJSSeptember 15, 2023 at 10:17 am #43754Looks like the file is corrupted. I am unable to extract the files from the zipped folder. It is empty. Can you please re-share again.
September 15, 2023 at 5:15 pm #43755We have updated the sample and it seems to be working fine now. Please use the same link shared earlier, to download the sample project.
—
Thangaraj Raman
Team CanvasJSSeptember 17, 2023 at 11:06 am #43761Hi Thangaraj,
Superb. It works now perfectly. Thanks a lot. One issue on the chart the plotted value appears on the y-axis line. Can this be adjusted and the plotted value can be made more readable? Any solution?
Regards,
Meena.September 19, 2023 at 5:49 pm #43771Meena,
You can make the indexlabel more readable by either increasing the font size of indexLabels by setting indexLabelFontSize property or changing the color of indexLabels by setting indexLabelFontColor.
—
Thangaraj Raman
Team CanvasJSSeptember 21, 2023 at 10:40 am #43779Thangaraj,
Is it possible to add padding to that text so that it appears little above. Because we want to use the same font size across. So I doubt if I can increase the size
Regards,
meenaSeptember 22, 2023 at 6:36 pm #43790Meena,
[UPDATE]
We have just released v3.11.0 with a new feature called indexLabelPadding. Please refer to the release blog for more information. Do download the latest version from our download page and let us know your feedback.
It is not possible to add padding/margin to indexlabels as of now.
—
Thangaraj Raman
Team CanvasJSSeptember 28, 2023 at 11:27 am #43817ok Thangaraj.
You must be logged in to reply to this topic.