Login to Ask a Question or Reply
Forum Replies Created by Suyash Singh
-
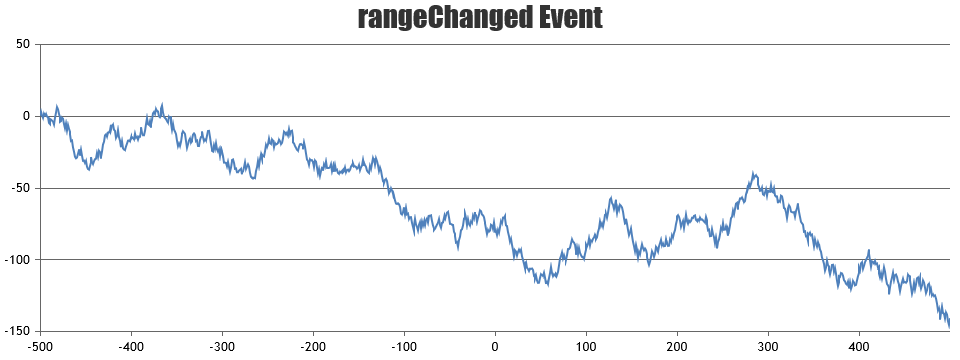
rangeChanged and rangeChanging events are fired on zooming, panning and reset. Please, take a look at this page for more details.

___
Suyash Singh
Team CanvasJSJune 29, 2017 at 11:50 am in reply to: MarkerType different by different amounts of datapoints #15450We couldn’t reproduce the issue on our end. As seen in this jsfiddle it seems to be working fine.
Can you please create a jsfiddle reproducing the issue so that we can look into it and help you out better?
___
Suyash Singh
Team CanvasJSSorry, variable dataPoint width is not supported as of now. However, you can add spaces between the stacked columns by adding an transparent dataSeries in between before rendering the chart. Please have a look at this work-around.
___
Suyash Singh
Team CanvasJSSorry, I am unable to understand your exact requirement. Can you please help us with some more explanation on what do you mean by “legend keys” so that we can understand your scenario better and help you out?
Can you let us know if you are looking for Legends ?
___
Suyash Singh
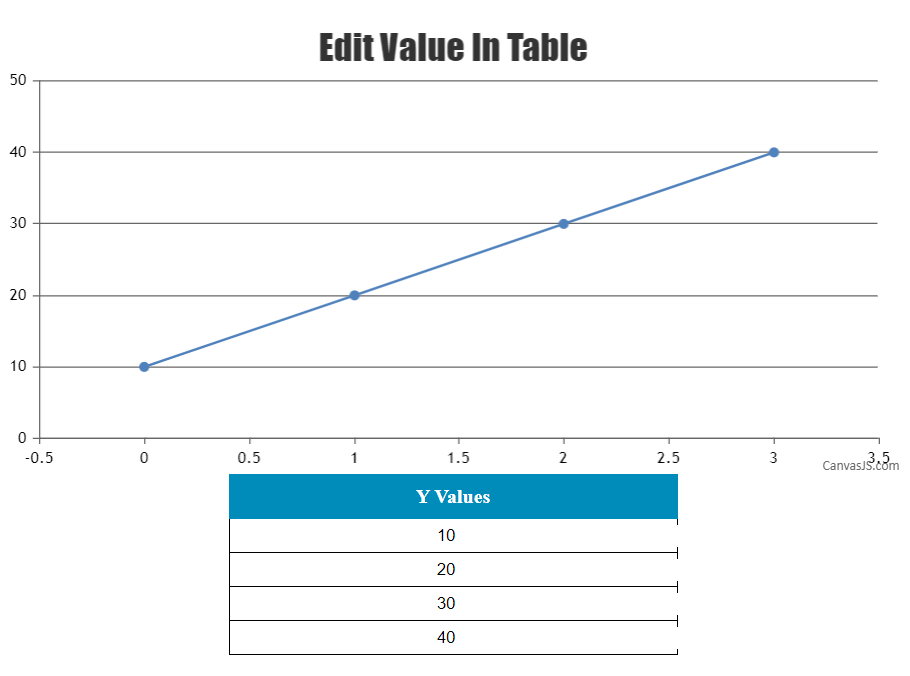
Team CanvasJSYou can easily create a chart using the values from HTML Table data and can also update the dataPoints once the table data is changed as shown in the code snippet below:
document.getElementById('customTable').addEventListener("change", function (e) {
  index = e.target.parentNode.parentNode.rowIndex;

  if (!chart.options.data[0].dataPoints[index - 1])
    chart.options.data[0].dataPoints[index - 1] = {};

  chart.options.data[0].dataPoints[index - 1].y = Number(e.target.value);
  chart.render();
});
Please take a look at this JSFiddle for a working example with sample code on rendering chart from HTML Table data.

___
Suyash Singh
Team CanvasJSJune 20, 2017 at 10:19 pm in reply to: Removing vertical lines and keeping x-axis and y-axis only #15356You can remove the gridLines by setting gridThickness to zero. Also you can use stripLines for showing reference lines. Please have a look at this code snippet:
axisY: {
    gridThickness: 0,
    stripLines: [
      {
        value: 0,
        showOnTop: true,
        color: "gray",
        thickness: 2
      }
    ]
 },
Please take a look at this JSFiddle for complete code.

If this doesn’t suit your requirements, can you please provide us some pictorial representation so that we can understand your requirements and help you out.
___
Suyash Singh
Team CanvasJSYou can set border property to the chart container to show a border around it as shown below:
<div id="chartContainer" style="height: 360px; width: 100%; border: 2px solid black;"></div>Or you can take a look at this jsfiddle.
If this doesn’t suit your requirements, can you please provide us some pictorial representation so that we can understand your requirements and help you out.___
Suyash Singh
Team CanvasJSSeems like you are using an old version of CanvasJS. destroy() is available since v1.9.8.1. Kindly download the latest version and let us know your feedback.
___
Suyash Singh
Team CanvasJS@fbk,
Please create a sample project reproducing the problem that you are facing and share it with us, so that we can have a look at your code and help you out.
___
Suyash Singh
Team CanvasJS@fbk,
Please make sure that you have included CanvasJS library in your project.
___
Suyash Singh
Team CanvasJSHi @jjas850,
Seems like your dataPoints weren’t sorted. Please have a look at this updated jsfiddle.
___
Suyash Singh
Team CanvasJS@fbk,
If you are switching from any other library to CanvasJS, you will need to parse the data in the format accepted by CanvasJS. Also please refer this thread on rendering CanvasJS Chart using Socket.io.
___
Suyash Singh
Team CanvasJS