Login to Ask a Question or Reply
You must be logged in to post your query.
Home › Forums › Chart Support › How can I plot values from .txt file ?
How can I plot values from .txt file ?
- This topic has 38 replies, 7 voices, and was last updated 9 years, 2 months ago by
Suyash Singh.
-
August 15, 2014 at 10:52 pm #6771
Hi guy, really need some good hands here !!!
I got a file with all data I need inside, I saved it as the text file, Ex : testgraph.txt
How can I plot those data, X axis will be set with 1,2,3,4…., Y axis will be set with values from the text file.
Need help !!!
Thanks a lot & I really appreciate :)The text file’s values :
192
20
131
38
84
112
1234
3421
1241
2314-
This topic was modified 11 years, 11 months ago by
hitmanbaby2007.
August 16, 2014 at 6:01 pm #6773Why it doesn’t work ?
<!DOCTYPE html>

<?PHP

$file_handle = fopen("testgraph.txt", "r");

while (!feof($file_handle) ) {

$line_of_text = fgets($file_handle);
$parts = explode(' ', $line_of_text);

//print $parts[0]. "<BR>";
// $parts[0]. $parts[1].
}

fclose($file_handle);

?>

<html>
<head>
  <meta http-equiv="content-type" content="text/html; charset=UTF-8">
  <title>Generating DataPoints in a loop - jsFiddle demo by anjalij</title>

  <script type='text/javascript' src='/js/lib/dummy.js'></script>


  <link rel="stylesheet" type="text/css" href="/css/result-light.css">

  <style type='text/css'>

  </style>


<script type='text/javascript'>//<![CDATA[
window.onload=function(){
    var limit = 100;    //increase number of dataPoints by increasing this
    var y = 0;
    var x=0;
    var data = []; var dataSeries = { type: "line" };
    var dataPoints = [];
    for (var i = 0; i < limit; i += 1) {
      y = <?php echo $parts[i] ?>;
      dataPoints.push({
          x: i,
          y: y
      });
      x+= 0.25;
    }

    dataSeries.dataPoints = dataPoints;
    data.push(dataSeries);


  var chart = new CanvasJS.Chart("chartContainer",
    {
      zoomEnabled: true,
      title:{
        text: "Generating DataPoints in a loop"
      },
      axisX:{
        //minimum: 0,
        //maximum: 300 ,
        valueFormatString:"0.00"
      },
      data: data,
   });
  chart.render();

}//]]>

</script>

</head>
<body>
  <script type="text/javascript" src="https://cdn.canvasjs.com/canvasjs.min.js"></script>
<div id="chartContainer" style="height: 300px; width: 100%;"></div>

</body>

</html>
My .txt file is here :
http://ladykillernicky.uni.me/testgraph.txtAugust 19, 2014 at 12:30 pm #6786Hi,
From what I can see you are trying to parse text file on the server side which is not required – we can do it on the client side itself. At the same time you have included PHP code inside javascript loop which will not work.
<?php echo $parts[i] ?>Here is an example that I have created which parses your text file on the client side.
<!DOCTYPE HTML>
<html>
<head>
<script type="text/javascript" src="jquery-2.1.1.js"></script>
<script type="text/javascript">
window.onload = function () {
var dataPoints = [];

//Replace text file's path according to your requirement.
$.get("testgraph.txt", function(data) {
	var x = 0;
	var allLines = data.split('\n');
	if(allLines.length > 0) {
		for(var i=0; i< allLines.length; i++) {
			dataPoints.push({x: x , y: parseInt(allLines[i])});
			x += .25;
		}
	}
	var chart = new CanvasJS.Chart("chartContainer",{
		title :{
			text: "Chart using Text File Data"
		},
		data: [{
			type: "line",
			dataPoints : dataPoints,
		}]
	});
	chart.render();
});
}
</script>
<script type="text/javascript" src="https://cdn.canvasjs.com/canvasjs.min.js"></script>
</head>
<body>
<div id="chartContainer" style="height: 300px; width: 100%;"></div>
</body>
</html>
—
AnjaliAugust 20, 2014 at 3:54 pm #6793Thank you so so much for helping me out, I have had some roughly day to deal with this problem. May be all I need now to have some extra function such as zoom or scale to analyze the graph more easier.
Thank you with all shining stars above the sky !!! ^^
August 20, 2014 at 6:27 pm #6845By the way, I’ve been wondering that, why my .txt file just have a few numbers as the link I posted above but the code I used from you finally plo a lot of points, looks like it repeatedly do it again the whole number of values
inside the .txt file. Please look at this link and you will know what I wanna say :http://ladykillernicky.uni.me/graph.php
I’m using Firefox and Chrome to check them out but it shows the same results !!!
I know what the things came wrong i< allLines.length, but I can’t solve this problem.
-
This reply was modified 11 years, 11 months ago by
dungeonlegend.
August 21, 2014 at 1:30 pm #6896The text file that you provided is testgraph.txt and the one that you using in above page is testECG.txt which has values that are repeating.
—
Sunil UrsApril 5, 2017 at 2:10 pm #14767hi all,
i want to read a text file with information being updated every second and display it in a html bar graph (with a single bar) x-axis is the time and y-axis the frequency – i’ve been looking around to find a solution, tried a few codes from others but it didnt work, can someone help me please its got to be a web based technology html/jscript etc. Im totally a novice in this and your kind help would be great
thanksApril 6, 2017 at 6:52 pm #14774@fbk,
Can you please provide us more information regarding the format of the dataPoints that you are storing in text file. Parsing the data stored in text file to the format accepted by CanvasJS should work fine in this case. For more information on retrieving data from a text file, please refer this stackoverflow thread.
___
Suyash Singh
Team CanvasJSApril 6, 2017 at 7:01 pm #14775hi, thanks for reply
so the file is an outcome of MATLAB which when opens has two columns separated by space
and has about 20 entries..the file will be stored on same computer and is refreshed every 1sec.
from canvasJS threads i was able to come up with a solution to display randomly generated numbers in a graph but now its to be dealt with a file with real data.
looking forward for reply
thanksApril 7, 2017 at 3:01 pm #14779@fbk,
Kindly refer this JSFiddle for an example on creating chart with data from text file.
The format of data used in text file (dataPoints.txt):
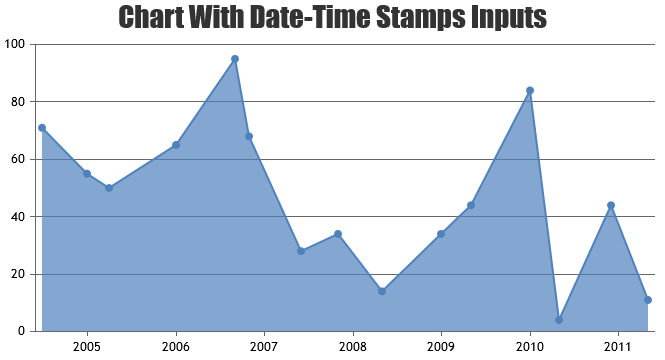
10 20
15 25
20 15
25 33
30 9
35 15
40 20
Also refer to this documentation page for more information on using date-time values in axisX.
___
Suyash Singh
Team CanvasJSApril 7, 2017 at 3:22 pm #14781hi thanks
but thats not the case perhaps i described wrong
the file look like this (the first column is identifier that the value is positive or negative) and the second column
with actual value:
pos 0.20
neg 0.17
neg 0.43
pos 0.13
pos 0.27
neg 0.19
neg 0.49
pos 0.12
. .
. .
so on to about 20 entries – i know how to put time on x-axis(referenced from another tutorial)
and display its graph however with randomly generated numbers but not from a file.
thanksApril 7, 2017 at 6:19 pm #14784April 7, 2017 at 6:53 pm #14786hi thanks
but its not working the fiddleApril 7, 2017 at 7:12 pm #14787hi
so nice of you to bear with me ..im a dummy as you can see
anyway here is the whole code please let me know how can i start reading the file instead of random numbers and plot a graph using this code
the file has following contents and is updated every second
Neg 0.75
Pos 0.63
Pos 0.82
Neg 0.54
Pos 0.67
Pos 0.83
Neg 0.56
Pos 0.68
Neg 0.58
Neg 0.71
Pos 0.66
Neg 0.89
Neg 0.71
Pos 0.63
Neg 0.8
Neg 0.71
Neg 0.69
Pos 0.88
Neg 0.73
Pos 0.61
Pos 0.89
Neg 0.72
Neg 0.54
Pos 0.53
Neg 0.57
Neg 0.58
Pos 0.54
Neg 0.56
Neg 0.68
Pos 0.75
Neg 0.65
Pos 0.53
Neg 0.72
END -999the code is as follows
<!DOCTYPE HTML>
<html><head>
<script type=”text/javascript”>
window.onload = function () {// dataPoints
var dataPoints1 = [];
var dataPoints2 = [];
var dataPoints3 = [];var chart = new CanvasJS.Chart(“chartContainer”,{
zoomEnabled: true,
title: {
text: “testing ”
},
toolTip: {
shared: true},
legend: {
verticalAlign: “top”,
horizontalAlign: “center”,
fontSize: 14,
fontWeight: “bold”,
fontFamily: “calibri”,
fontColor: “dimGrey”
},
axisX: {
title: “RR @ 1 sec”
},
axisY:{
prefix: ‘ ‘,
includeZero: false
},
data: [{
// dataSeries1
type: “line”,
xValueType: “dateTime”,
showInLegend: true,
name: “result1”,
dataPoints: dataPoints1
},
{
// dataSeries2
type: “line”,
xValueType: “dateTime”,
showInLegend: true,
name: “result2” ,
dataPoints: dataPoints2
},
{
// dataSeries3
type: “line”,
xValueType: “dateTime”,
showInLegend: true,
name: “Average” ,
dataPoints: dataPoints3
}],
legend:{
cursor:”pointer”,
itemclick : function(e) {
if (typeof(e.dataSeries.visible) === “undefined” || e.dataSeries.visible) {
e.dataSeries.visible = false;
}
else {
e.dataSeries.visible = true;
}
chart.render();
}
}
});var updateInterval = 1000;
// initial value
var yValue1 = 000;
var yValue2 = 000;
var yValue3 = 000;var time = new Date;
/*time.setHours(9);
*/ /*time.setMinutes(30);*/
time.setSeconds(00);
time.setMilliseconds(00);
// starting at 9.30 amvar updateChart = function (count) {
count = count || 1;// count is number of times loop runs to generate random dataPoints.
for (var i = 0; i < count; i++) {
// add interval duration to time
time.setTime(time.getTime()+ updateInterval);// generating random values
var deltaY1 = .5 + Math.random() *(-.5-.5);
var deltaY2 = .5 + Math.random() *(-.5-.5);
var deltaY3 = .5 + Math.random() *(-.5-.5);// adding random value and rounding it to two digits.
yValue1 = Math.round((yValue1 + deltaY1)*100)/100;
yValue2 = Math.round((yValue2 + deltaY2)*100)/100;
yValue3 = Math.round((yValue3 + deltaY3)*100)/100;// pushing the new values
dataPoints1.push({
x: time.getTime(),
y: yValue1
});
dataPoints2.push({
x: time.getTime(),
y: yValue2
});
dataPoints3.push({
x: time.getTime(),
y: (yValue1+yValue2)/2
});
};// updating legend text updated with y Value
chart.options.data[0].legendText = ” result1 ” + yValue1;
chart.options.data[1].legendText = ” result2 ” + yValue2;
chart.options.data[2].legendText = ” Average ” + yValue3;chart.render();
/* opens a smiley if positive and a sad smiley if negative value*/
if(yValue3 > 0)
{window.open(‘https://s-media-cache-ak0.pinimg.com/736x/4e/5c/f7/4e5cf7d4ccb9c59b6620a9c71944d51e.jpg’, “emowindow”,”width=400, height= 400″)
} else if (yValue3 < 0)
{
window.open(‘https://cdn.shopify.com/s/files/1/1061/1924/products/Sad_Face_Emoji_large.png?v=1480481055’,”emowindow”,”width=400, height= 400″)
}
};// generates first set of dataPoints
updateChart(1000);// update chart after specified interval
setInterval(function(){updateChart()}, updateInterval);
}
</script>
<script type=”text/javascript” src= “script/canvasjs.min.js”></script>
</head>
<body>
<div id=”chartContainer” style=”height: 500px; width: 60%;”>
</div>
</body>
</html>i truly appreciate your kind efforts towards this!
thanks in advanceApril 8, 2017 at 11:36 am #14799Seems like the jsfiddle is working fine.
You need to create a text file saydataPoints.txtwith the content as shown below, browse it using theChoose Fileinput and clickOpen.pos 0.20 neg 0.17 neg 0.43 pos 0.13 pos 0.27 neg 0.19 neg 0.49 pos 0.12If you are still facing any issue kindly reproduce the same in jsfiddle so that we can look into the issue and help you better.
___
Suyash Singh
Team CanvasJS -
This topic was modified 11 years, 11 months ago by
You must be logged in to reply to this topic.