Login to Ask a Question or Reply
You must be logged in to post your query.
Home › Forums › Chart Support › Button to zoom
Button to zoom
- This topic has 8 replies, 3 voices, and was last updated 9 years ago by
Emeric.
-
June 14, 2017 at 8:01 pm #15304
Hello,
I’m using CanvasJS since few weeks and I have a question about zoom.
I saw we can zoom easily by drag & drop but I would like to create a button to zoom (by click).
Example: I have a button “x2” and when i click on it it zooms x2 on my graph (no drag & drop, just a click).
I searched a lot and i found nothing.Thank you in advance !
(Sorry my english isn’t perfect !)June 15, 2017 at 9:55 am #15312Emeric,
You can programmatically zoom into certain region by setting viewportMinimum and viewportMaximum. If you like to set zoom into certain region after clicking the button, you can do so by changing viewportMinimum & viewportMaximum on clicking the button. Below is the code-snippet for the same.
document.getElementById("zoomBtn").addEventListener("click", function(){
  chart.axisX[0].set("viewportMinimum", new Date(2002, 01, 01), false);
  chart.axisX[0].set("viewportMaximum", new Date(2006, 01, 01));
});
Please take a look at this JSFiddle for complete code.
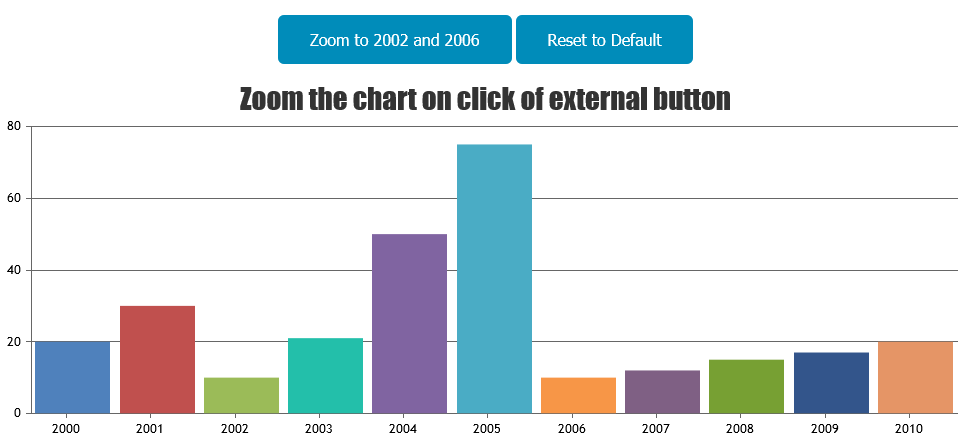
Also take a look at this jsfiddle, where viewportMinimum and viewportMaximum are changed based on dropdown options.
—
Vishwas R
Team CanvasJSJune 15, 2017 at 12:27 pm #15313Thank you a lot that’s it !
June 29, 2017 at 3:15 pm #15453I have another question with viewport.
For example I have this graph: https://canvasjs.com/docs/charts/basics-of-creating-html5-chart/zooming-panning/
We can zoom by using drag & drop, is it possible to get the viewportMinimum and the viewportMaximum of this zoom ?
I tried to console.log both but it’s “undefined”. Is it possible to get this value after zooming with the mouse ?Thank’s !
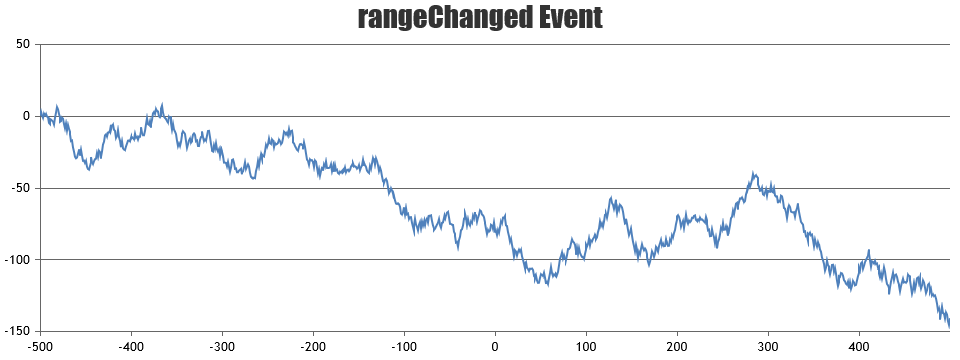
June 29, 2017 at 5:08 pm #15454rangeChanged and rangeChanging events are fired on zooming, panning and reset. Please, take a look at this page for more details.
___
Suyash Singh
Team CanvasJSJune 30, 2017 at 7:46 pm #15465Hello Suyash Singh,
Thank you for your answer.
I saw we can get the number of event but what I want is the value/label of X when I zoom or when I use the pan. I don’t really understand how it works, can you tell more ?
Best regards,
EmericJune 30, 2017 at 10:55 pm #15467When you change the viewport range by either zooming, panning or reset rangeChanging and rangeChanged events are fired. rangeChanging event is fired just before the current viewports are updated and the rangeChanged is fired on updation of the current viewports i.e. after zooming, panning or reset. An event parameter is passed to the event handler that you assign to the rangeChanging/rangeChanged event.This parameter contains current viewportMinimum, viewportMaximum and other properties.
You can use the viewportMinimum and viewportMaximum to check in which range of the axis you have zoomed into.
Please have a look at this jsfiddle in which all the dataPoints in the current zoomed range is displayed in the browser console.
Also please refer the following jsfiddle which shows the viewports on zooming/panning.
—
Suyash Singh
Team CanvasJSJuly 3, 2017 at 1:11 pm #15472Oh ok thank you a lot !
You must be logged in to reply to this topic.