Login to Ask a Question or Reply
Forum Replies Created by Suyash Singh
-
January 18, 2018 at 11:05 am in reply to: multi-series within multi-chart and together control zoom. #18890
Eric,
Sorry, we don’t have any ready container-based apps as of now. However you can check out our Dashboards and download them.
___
Suyash Singh
Team CanvasJSYou can calculate simple moving average(SMA) by writing few lines of code and pushing the respective values to dataSeries will render the chart with SMA series. Please take a look at the below code snippet for calculating 7 Day SMA and pushing it to chart dataSeries.
function calculateMovingAverage(chart) {
  var numOfDays = 7;
  // return if there are insufficient dataPoints
  if(chart.options.data[0].dataPoints.length <= numOfDays) return;
  else {
    // Add a new line series for  Moving Averages
    chart.options.data.push({
      type: "spline",
      markerSize: 0,
      name: "SMA",
      yValueFormatString: "#,##0.00",
      dataPoints: []
    });
    var total;
    for(var i = numOfDays; i < chart.options.data[0].dataPoints.length; i++) {
      total = 0;
      for(var j = (i - numOfDays); j < i; j++) {
        total += chart.options.data[0].dataPoints[j].y;
      }
      chart.options.data[1].dataPoints.push({
        x: chart.options.data[0].dataPoints[i].x,
        y: total / numOfDays
      });
    }
  }
}
Also, Please have a look at this JSFiddle for complete code.
___
Suyash Singh
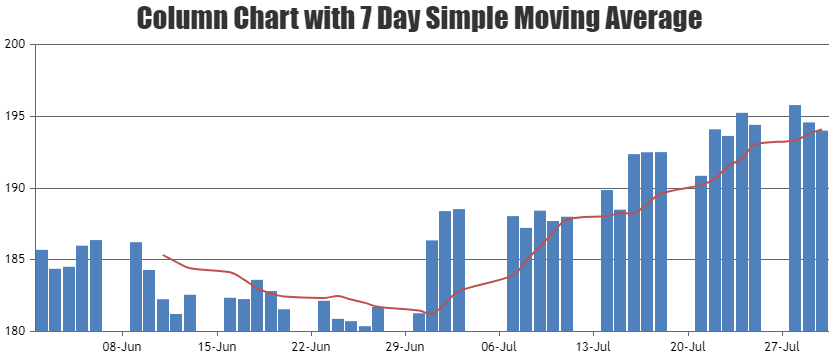
Team CanvasJSJanuary 17, 2018 at 12:41 pm in reply to: combining candlestick chart and line chart (moving average line) #18877To calculate 7 days Simple Moving Average you can loop through the column series, then sum up consecutive 7 days y-value and use the same in spline series representing Simple Moving Average as shown in the below code snippet –
function calculateMovingAverage(chart) {
  var numOfDays = 7;
  // return if there are insufficient dataPoints
  if(chart.options.data[0].dataPoints.length <= numOfDays) return;
  else {
    // Add a new line series for  Moving Averages
    chart.options.data.push({
      type: "spline",
      markerSize: 0,
      name: "SMA",
      yValueFormatString: "#,##0.00",
      dataPoints: []
    });
    var total;
    for(var i = numOfDays; i < chart.options.data[0].dataPoints.length; i++) {
      total = 0;
      for(var j = (i - numOfDays); j < i; j++) {
        total += chart.options.data[0].dataPoints[j].y;
      }
      chart.options.data[1].dataPoints.push({
        x: chart.options.data[0].dataPoints[i].x,
        y: total / numOfDays
      });
    }
  }
}
Please take a look at this JSFiddle on Column Chart with 7 Day Simple Moving Average. Also kindly have a look at:
1. Creating charts from database in ASP.NET MVC Application.
2. ASP.NET Download Samples___
Suyash Singh
Team CanvasJSJanuary 17, 2018 at 12:38 pm in reply to: combining column chart and line chart (moving average) #18876Please have a look at this jsfiddle on Column Chart with 7 Day Simple Moving Average. Also kindly have a look at:
1. Creating charts from database in ASP.NET MVC Application.
2. ASP.NET Download Samples
___
Suyash Singh
Team CanvasJSJanuary 17, 2018 at 10:14 am in reply to: multi-series within multi-chart and together control zoom. #18869@eu.mesma,
Please take a look at this jsfiddle.
___
Suyash Singh
Team CanvasJSJames,
Since your new CSV has a blank line in the end, you will either have to delete the blank line in your CSV or change the code accordingly as in this jsfiddle.
___
Suyash Singh
Team CanvasJSJanuary 12, 2018 at 1:13 pm in reply to: valueFormatString Format Specifier for full length number? #18647James,
Are you looking for something like this? If not, please provide a representation of your requirement.
___
Suyash Singh
Team CanvasJSJames,
Can you please explain more about your requirements, so that we can help you out better. Also, it would be great if you could:
1. Elaborate what you mean by
I would like to label each column with a final result like this:
2. Provide us some pictorial representation of the chart you are looking for.
3. Explain what all the columns in your CSV file represent.
4. Mention the values to be represented on axis X and axis Y.
5. Provide us some sample data points.
___
Suyash Singh
Team CanvasJS